Notch, Id2, and RORγt sequentially orchestrate the fetal development of lymphoid tissue inducer cells - PubMed (original) (raw)
Notch, Id2, and RORγt sequentially orchestrate the fetal development of lymphoid tissue inducer cells
Marie Cherrier et al. J Exp Med. 2012.
Abstract
Lymphoid tissue development is initiated during embryogenesis by the migration of lymphoid tissue inducer (LTi) cells from the fetal liver to the periphery, where they induce the formation of lymph nodes and Peyer's patches. In the fetal liver, a subset of common lymphoid progenitors (CLPs) that expresses the integrin α4β7 gives rise to LTi cells, a process strictly dependent on the expression of the transcriptional repressor Id2 and the nuclear hormone receptor retinoic acid-related orphan receptor γ t (RORγt). In this study, we show that Id2 and RORγt are sequentially up-regulated during LTi cell development, matching two waves of differentiation with opposite requirements for Notch signaling. Both the expression of Id2 and Notch are required for the generation of α4β7(+) RORγt(-) fetal progenitors, but Notch subsequently blocks progression to the RORγt(+) stage and final maturation of LTi cells. Notch is therefore a necessary switch to engage the LTi developmental pathway, but needs to be turned off later to avoid diversion to the T cell fate.
Figures
Figure 1.
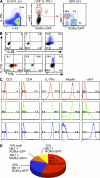
Generation of RORγt+ cells from fetal liver α4β7+ RORγt− progenitors. (A) Flow cytometry analysis of Lin− cells from the fetal liver of E14 _Rorc(γt)-Gfp_TG mice. Lin− c-Kit+ IL-7Rα+ α4β7+ RORγt− cells were sorted and cultured for 14 d on OP9 stromal cells in the presence of IL-7 and SCF. Data are representative of at least three independent experiments performed with four to six fetuses each. (B) Production of IL-17, IL-22, and IFN-γ by NK1.1+ RORγt− cells (red), NK1.1+ RORγt+ cells (green), and NK1.1− RORγt+ cells (blue), as indicated in A, after 3 h of stimulation with PMA and ionomycin. Data are representative of three independent experiments. (C) Cultures described in A were analyzed for the expression of surface markers. Data are representative of at least three independent experiments. (D) Pie chart summarizing the phenotype of 52 clones cultured individually from single fetal liver α4β7+ RORγt− cells on OP9 stromal cells for 14 d.
Figure 2.
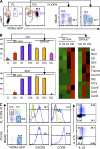
In vitro– versus in vivo–generated LTi cells. Fetal liver (FL) and fetal gut (FG) cells were isolated from E14 _Rorc(γt)-Gfp_TG mice. (A) Flow cytometry analysis of Lin− c-Kit+ IL-7Rα+ cells from the fetal liver and gut of E14 _Rorc(γt)-Gfp_TG mice. CLPs, α4β7+ RORγt− cells, and α4β7+ RORγt+ cells are labeled stage I, II, and III, respectively; the appearance of “b” with these designations indicates that cells were isolated from the gut. Stage II/IIb (red) and stage III/IIIb (blue) cells were sorted and cultured and/or analyzed for gene expression. After 7 d of culture on OP9 cells, stage III/IIIb cells (gold) and NKp46+ RORγt− (NK) cells (pink) were sorted and analyzed for gene expression. (B, left) Relative expression of Lta and Il23r in the indicated cell populations. Data are from three independent experiments. Error bars are SD. (right) Heat map of qPCR analysis from in vivo–isolated stage II to IIIb cells, and in vitro–generated NK cells, stage III, and IIIb cells. Data are the mean of at least three independent samples. (C) Flow cytometry analysis of cultured fetal liver stage II cells (top row) and ex vivo–isolated fetal gut stage IIIb cells (bottom row). Data are representative of at least three independent experiments.
Figure 3.
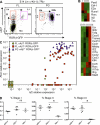
Sequential expression of Id2 and RORγt confers LTi function. (A) Flow cytometry analysis of Lin− c-Kit+ IL-7Rα+ cells from the fetal liver (FL) and fetal gut (FG) of E14 _Rorc(γt)-Gfp_TG mice. The dot plot on the left was duplicated from Fig. 1 A to illustrate the gating strategy. Dashed arrows suggest the lineage relationship between cell subsets I–III. The data are representative of at least three independent experiments performed with four to six fetuses each. (B) Heat map of qPCR analysis of freshly isolated cells. Data are from at least three independent samples for each subpopulation. (C) Single-cell qPCR analysis of Id2 (x axis) and Rorc (y axis) expression in 32 fetal liver stage I cells (green), 64 fetal liver stage II cells (red), and 32 fetal gut stage IIIb cells (blue). (D) The frequency of fetal liver stage I, II, and III cells in Id2-sufficient or -deficient mice was measured by flow cytometry. The data were pooled from three independent experiments with five mice per group, except for Id2−/− mice with three mice per group. Statistical significance was assessed by the unpaired Student’s t test. *, P < 0.001. Error bars are SD.
Figure 4.
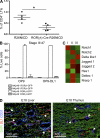
LTi cells and NK22 develop from distinct precursors. (A) RORγt-E18 fetal liver stage II cells (red gate; left) or Lin− α4β7− RORγtlow cells (red gate; right) were cultured on OP9 cells for 10 d, and the resulting Lin− RORγt+ cells were assessed for NKp46 expression by flow cytometry (bottom). Data are representative of at least three independent experiments. (B) Lin− cells were isolated from the fetal liver of Id2-sufficient or -deficient mice, and the frequency of α4β7− RORγtlow cells was measured by flow cytometry. Data are from three independent experiments with three mice per group. Statistical significance was assessed by the unpaired Student’s t test. Error bars are SD.
Figure 5.
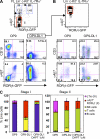
Notch signaling plays opposite roles at successive stages of LTi cell differentiation. (A) Stage I (Lin− c-Kit+ IL-7Rα+ α4β7−) cells were sorted from fetal liver (FL) and cultured on OP9 or OP9-DL1. (B) After 5 d, stage II (Lin− c-Kit+ IL-7Rα+ α4β7+) cells were sorted from OP9-DL1 cultures and transferred to OP9 or OP9-DL1 cultures for 7 d. Expression of CD19, CD3, α4β7, and RORγt was measured by flow cytometry. Data are representative of three independent experiments. (C) E14 fetal liver stage I and II cells were sorted and cultured on OP9 or OP9-DL1 treated with 1 µM γ-secretase inhibitor DAPT or vehicle. Bar graphs show the proportions of LTis (III), Lin− α4β7+ RORγt− (II), and NK, T, and B cells generated from stage I and stage II cells after 10 d of culture. Data are from three independent experiments. Error bars are SD.
Figure 6.
Sustained Notch signaling blocks the development of LTi cells in vivo. (A) Hematopoietic cells were isolated from the gut of newborn mice expressing Notch intracellular domain (NICD) under the control of the RORγt locus (Rorc(γt)-Cre x R26NICD) or control mice (R26NICD). The frequency of CD4+ LTis among CD3− NKp46− cells was measured by flow cytometry. Data are pooled from two independent experiments with four mice per group. Statistical significance was assessed by the unpaired Student’s t test. *, P < 0.001. Error bars are SD. (B) Stage III cells were sorted from the fetal liver and cultured on OP9 or OP9-DL1 for 7 d. The proportion of each cell subsets, defined by the expression of NKp46 and RORγt-GFP, was analyzed by flow cytometry. Data are from four independent experiments. Error bars are SD. (C) Heat map of qPCR analysis for Notch, Notch ligands, and Notch target genes in fetal liver stage I, II, and III cells. qPCR analysis was performed using at least three independent samples for each cell subset. (D) Immunostaining for CD31 (blue) and DL1 (red) of fetal liver and thymus (E18). Pictures were taken at 200x magnification. Examples of micro-niches expressing DL1 are indicated by white arrowheads.
Figure 7.
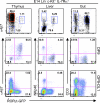
Thymic Lin− α4β7+ cells generate LTi-like cells in the absence of Notch signaling. Lin− c-Kit+ IL-7Rα2+ cells were isolated from the thymus, liver, and gut of E14 _Rorc(γt)-Gfp_TG mice (top row), and expression of α4β7 and RORγt-GFP was analyzed by flow cytometry. Stage II cells (red) were then sorted from the thymus and cultured on OP9 (middle row) or OP9-DL1 (bottom row) stromal cells for 14 d, and further analyzed by flow cytometry. Data are representative of at least three independent experiments.
Similar articles
- Runx1/Cbfβ2 complexes are required for lymphoid tissue inducer cell differentiation at two developmental stages.
Tachibana M, Tenno M, Tezuka C, Sugiyama M, Yoshida H, Taniuchi I. Tachibana M, et al. J Immunol. 2011 Feb 1;186(3):1450-7. doi: 10.4049/jimmunol.1000162. Epub 2010 Dec 22. J Immunol. 2011. PMID: 21178013 - Notch signaling is necessary for adult, but not fetal, development of RORγt(+) innate lymphoid cells.
Possot C, Schmutz S, Chea S, Boucontet L, Louise A, Cumano A, Golub R. Possot C, et al. Nat Immunol. 2011 Sep 11;12(10):949-58. doi: 10.1038/ni.2105. Nat Immunol. 2011. PMID: 21909092 - The role of the nuclear hormone receptor RORgammat in the development of lymph nodes and Peyer's patches.
Eberl G, Littman DR. Eberl G, et al. Immunol Rev. 2003 Oct;195:81-90. doi: 10.1034/j.1600-065x.2003.00074.x. Immunol Rev. 2003. PMID: 12969312 Review. - Differential Expression of the Transcription Factor GATA3 Specifies Lineage and Functions of Innate Lymphoid Cells.
Zhong C, Zheng M, Cui K, Martins AJ, Hu G, Li D, Tessarollo L, Kozlov S, Keller JR, Tsang JS, Zhao K, Zhu J. Zhong C, et al. Immunity. 2020 Jan 14;52(1):83-95.e4. doi: 10.1016/j.immuni.2019.12.001. Epub 2019 Dec 24. Immunity. 2020. PMID: 31882362 Free PMC article. - Lymphoid tissue inducer cells in intestinal immunity.
Ivanov II, Diehl GE, Littman DR. Ivanov II, et al. Curr Top Microbiol Immunol. 2006;308:59-82. doi: 10.1007/3-540-30657-9_3. Curr Top Microbiol Immunol. 2006. PMID: 16922086 Review.
Cited by
- The origin and role of innate lymphoid cells in the lung.
Lai DM, Shu Q, Fan J. Lai DM, et al. Mil Med Res. 2016 Aug 19;3:25. doi: 10.1186/s40779-016-0093-2. eCollection 2016. Mil Med Res. 2016. PMID: 27547445 Free PMC article. Review. - Nuclear hormone receptors put immunity on sterols.
Santori FR. Santori FR. Eur J Immunol. 2015 Oct;45(10):2730-41. doi: 10.1002/eji.201545712. Epub 2015 Aug 27. Eur J Immunol. 2015. PMID: 26222181 Free PMC article. Review. - The transcription factor T-bet is essential for the development of NKp46+ innate lymphocytes via the Notch pathway.
Rankin LC, Groom JR, Chopin M, Herold MJ, Walker JA, Mielke LA, McKenzie AN, Carotta S, Nutt SL, Belz GT. Rankin LC, et al. Nat Immunol. 2013 Apr;14(4):389-95. doi: 10.1038/ni.2545. Epub 2013 Mar 3. Nat Immunol. 2013. PMID: 23455676 Free PMC article. - Embryonic ILC-poiesis across tissues.
Hernández-Torres DC, Stehle C. Hernández-Torres DC, et al. Front Immunol. 2022 Dec 20;13:1040624. doi: 10.3389/fimmu.2022.1040624. eCollection 2022. Front Immunol. 2022. PMID: 36605193 Free PMC article. Review. - Runx3 specifies lineage commitment of innate lymphoid cells.
Ebihara T, Song C, Ryu SH, Plougastel-Douglas B, Yang L, Levanon D, Groner Y, Bern MD, Stappenbeck TS, Colonna M, Egawa T, Yokoyama WM. Ebihara T, et al. Nat Immunol. 2015 Nov;16(11):1124-33. doi: 10.1038/ni.3272. Epub 2015 Sep 28. Nat Immunol. 2015. PMID: 26414766 Free PMC article.
References
- Bain G., Maandag E.C., Izon D.J., Amsen D., Kruisbeek A.M., Weintraub B.C., Krop I., Schlissel M.S., Feeney A.J., van Roon M., et al. 1994. E2A proteins are required for proper B cell development and initiation of immunoglobulin gene rearrangements. Cell. 79:885–892 10.1016/0092-8674(94)90077-9 - DOI - PubMed
Publication types
MeSH terms
Substances
LinkOut - more resources
Full Text Sources
Other Literature Sources
Molecular Biology Databases
Miscellaneous
