Functionally distinct subsets of human FOXP3+ Treg cells that phenotypically mirror effector Th cells - PubMed (original) (raw)
Functionally distinct subsets of human FOXP3+ Treg cells that phenotypically mirror effector Th cells
Thomas Duhen et al. Blood. 2012.
Erratum in
- Blood. 2012 Nov 22;120(22):4447
Abstract
FOXP3+ regulatory T (Treg) cells are a broadly acting and potent anti-inflammatory population of CD4+ T cells essential for maintaining immune homeostasis and preventing debilitating autoimmunity. Based on chemokine receptor expression, we identified distinct populations of Treg cells in human blood expected to colocalize with different Th cell subsets. Although each population was functionally suppressive, they displayed unique patterns of pro- and anti-inflammatory cytokine production, differentially expressed lineage-specifying transcription factors, and responded differently to antigens associated with Th1 and Th17 responses. These results highlight a previously unappreciated degree of phenotypic and functional diversity in human Treg cells that allows subsets with unique specificities and immunomodulatory functions to be targeted to defined immune environments during different types of inflammatory responses.
Figures
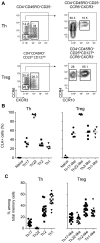
Figure 1
Chemokine receptor expression defines human Treg cell subsets. (A) Representative flow cytometric analysis of CCR6, CXCR3, CCR4, and CCR10 expression by gated CD4+CD45RO+CD25− Th cells (top panels) and CD4+CD45RO+CD25hiCD127lo Treg cells (bottom panels) from peripheral blood. (B) Expression of CLA by the indicated Th and Treg cell subsets. Each symbol represents 1 donor; horizontal bars indicate the mean. Data are from 5 donors. (C) Frequency of cells expressing the indicated chemokine receptor combinations among Th and Treg cells. Each symbol represents 1 donor; horizontal bars indicate the mean. Data are from 15 donors.
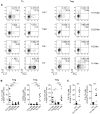
Figure 2
Treg cell subsets are functionally suppressive. (A) Expression of FOXP3 by the indicated Th and Treg cell subsets. Each symbol represents 1 donor; horizontal bars indicate the mean. Data are from 9 donors. (B) Expression of Helios (left) and CTLA-4 (right) by the indicated Th and Treg cell subsets. Data are from 3 or 5 donors. (C) CFSE-labeled CD4+CD25− responder T cells were cultured with autologous monocytes plus anti-CD3 (OKT3) in the presence or absence of the indicated sorted Treg cell subset at a 1:1 suppressor/responder ratio. Numbers indicate the frequency of proliferating CFSElo T cells after 5 days of culture. Data are representative of 3 independent experiments.
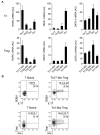
Figure 3
Th17- and Th1-like Treg cells coproduce pro- and anti-inflammatory cytokines. (A) Representative flow cytometric analysis of IL-10, IL-17, and IFN-γ production by sorted Th (left) and Treg (right) cell subsets stimulated for 5 hours with PMA/ionomycin. (B) Frequency of IL-17–, IL-10–, and IFN-γ–producing cells among gated FOXP3+ Treg cells in each of the indicated Treg cell subsets. Each symbol represents 1 donor; horizontal bars indicate the mean. Data are from 10 donors. *P < .05; ***P < .001 (ANOVA). (C) Frequency of IL-10–producing cells among IL-17+ cells in Th17 cells or Th17-like Treg cells (left) or among IFN-γ+ cells in Th1 cells or Th1-like Treg cells (right). Data are from 10 donors. ***P < .001 (2-tailed paired t test).
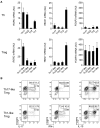
Figure 4
Th17- and Th1-like Treg cells express the lineage-specifying transcription factors RORγt and T-bet. (A) Quantitative RT-PCR analysis of RORγt (RORC), T-bet (TBX21), and GATA-3 (GATA3) expression by the indicated Th and Treg cell subsets. AU indicates arbitrary units. Data are means ± SEM of 7 donors. (B) Flow cytometric analysis of IFN-γ, IL-17, T-bet, and RORγt expression by sorted naive T cells (T naive), Th17-like, and Th1-like Treg cells stimulated for 5 hours with PMA/ionomycin. Data are representative of 3 independent experiments.
Figure 5
Th17- and Th1-like Treg cells are phenotypically and functionally stable. (A) Quantitative RT-PCR analysis of RORγt (RORC), T-bet (TBX21), and FOXP3 (FOXP3) expression by the indicated Th and Treg cell subsets after 9 days of in vitro expansion. AU indicates arbitrary units. Data are means ± SEM of 4 donors. (B) Flow cytometric analysis of FOXP3, IFN-γ, IL-17, and IL-10 expression on expanded Th17- and Th1-like Treg cells stimulated for 5 hours with PMA/ionomycin. Data are representative of 4 independent experiments.
Figure 6
Constitutive activation of human Treg cells. (A) Expression of ICOS (left) and Ki-67 (right) by the indicated Th and Treg cell subsets. Data are from 5 donors. (B) Flow cytometric analysis of ICOS and Ki-67 expression by the indicated Treg cell subsets. Data are representative of 4 donors. *P < .0.05; **P < .01; ***P < .001 (ANOVA).
Figure 7
_C albicans_– and HCMV-specific Treg cells are present in Th17- and Th1-like subsets. (A) Proportion of CFSElo cells (that had undergone 3 or more divisions) among the indicated Th and Treg cell subsets after 6 days of stimulation with autologous monocytes pulsed with C albicans or HCMV antigens. Each symbol represents 1 donor; small horizontal bars indicate the mean. Data are from 7 (C albicans) or 5 (HCMV) donors. (B) Flow cytometric analysis of cytokine production by gated CFSElo _C albicans_–specific Th and Treg cells after restimulation with PMA/ionomycin for 5 hours. Data are representative of 3 independent experiments using 3 different donors.
Similar articles
- Inflammation-associated genes: risks and benefits to Foxp3+ regulatory T-cell function.
O'Connor RA, Anderton SM. O'Connor RA, et al. Immunology. 2015 Oct;146(2):194-205. doi: 10.1111/imm.12507. Epub 2015 Sep 9. Immunology. 2015. PMID: 26190495 Free PMC article. Review. - Transcriptomic Profiling of Human Effector and Regulatory T Cell Subsets Identifies Predictive Population Signatures.
Höllbacher B, Duhen T, Motley S, Klicznik MM, Gratz IK, Campbell DJ. Höllbacher B, et al. Immunohorizons. 2020 Oct 9;4(10):585-596. doi: 10.4049/immunohorizons.2000037. Immunohorizons. 2020. PMID: 33037096 Free PMC article. - Identity and Diversity of Human Peripheral Th and T Regulatory Cells Defined by Single-Cell Mass Cytometry.
Kunicki MA, Amaya Hernandez LC, Davis KL, Bacchetta R, Roncarolo MG. Kunicki MA, et al. J Immunol. 2018 Jan 1;200(1):336-346. doi: 10.4049/jimmunol.1701025. Epub 2017 Nov 27. J Immunol. 2018. PMID: 29180490 - Identification of a human Th1-like IFNγ-secreting Treg subtype deriving from effector T cells.
Venigalla RK, Guttikonda PJ, Eckstein V, Ho AD, Sertel S, Lorenz HM, Tretter T. Venigalla RK, et al. J Autoimmun. 2012 Dec;39(4):377-87. doi: 10.1016/j.jaut.2012.06.004. Epub 2012 Jul 22. J Autoimmun. 2012. PMID: 22824211 - Th 17 cells interplay with Foxp3+ Tregs in regulation of inflammation and autoimmunity.
Mai J, Wang H, Yang XF. Mai J, et al. Front Biosci (Landmark Ed). 2010 Jun 1;15(3):986-1006. doi: 10.2741/3657. Front Biosci (Landmark Ed). 2010. PMID: 20515737 Free PMC article. Review.
Cited by
- Physiological and pathogenic T cell autoreactivity converge in type 1 diabetes.
Eugster A, Lorenc A, Kotrulev M, Kamra Y, Goel M, Steinberg-Bains K, Sabbah S, Dietz S, Bonifacio E, Peakman M, Gomez-Tourino I. Eugster A, et al. Nat Commun. 2024 Oct 29;15(1):9204. doi: 10.1038/s41467-024-53255-9. Nat Commun. 2024. PMID: 39472557 Free PMC article. - The Major Role of T Regulatory Cells in the Efficiency of Vaccination in General and Immunocompromised Populations: A Review.
Stepkowski S, Bekbolsynov D, Oenick J, Brar S, Mierzejewska B, Rees MA, Ekwenna O. Stepkowski S, et al. Vaccines (Basel). 2024 Aug 30;12(9):992. doi: 10.3390/vaccines12090992. Vaccines (Basel). 2024. PMID: 39340024 Free PMC article. Review. - Segmental patterning of microbiota and immune cells in the murine intestinal tract.
Anandakumar H, Rauch A, Wimmer MI, Yarritu A, Koch G, McParland V, Bartolomaeus H, Wilck N. Anandakumar H, et al. Gut Microbes. 2024 Jan-Dec;16(1):2398126. doi: 10.1080/19490976.2024.2398126. Epub 2024 Sep 10. Gut Microbes. 2024. PMID: 39254265 Free PMC article. - Relationship between Infant Feeding and the Microbiome: Implications for Allergies and Food Intolerances.
Herrera-Quintana L, Vázquez-Lorente H, Hinojosa-Nogueira D, Plaza-Diaz J. Herrera-Quintana L, et al. Children (Basel). 2024 Aug 22;11(8):1030. doi: 10.3390/children11081030. Children (Basel). 2024. PMID: 39201963 Free PMC article. Review. - T cells promote distinct transcriptional programs of cutaneous inflammatory disease in human skin structural cells.
DeBerg HA, Fahning ML, Schlenker JD, Schmitt WP, Gratz IK, Carlin JS, Campbell DJ, Morawski PA. DeBerg HA, et al. bioRxiv [Preprint]. 2024 Aug 31:2024.07.31.606077. doi: 10.1101/2024.07.31.606077. bioRxiv. 2024. PMID: 39131334 Free PMC article. Preprint.
References
- Duhen T, Geiger R, Jarrossay D, Lanzavecchia A, Sallusto F. Production of interleukin 22 but not interleukin 17 by a subset of human skin-homing memory T cells. Nat Immunol. 2009;10(8):857–863. - PubMed
- Trifari S, Kaplan CD, Tran EH, Crellin NK, Spits H. Identification of a human helper T cell population that has abundant production of interleukin 22 and is distinct from T(H)-17, T(H)1 and T(H)2 cells. Nat Immunol. 2009;10(8):864–871. - PubMed
Publication types
MeSH terms
Substances
Grants and funding
- R01 DK072295/DK/NIDDK NIH HHS/United States
- R01 AR055695/AR/NIAMS NIH HHS/United States
- DK072295/DK/NIDDK NIH HHS/United States
- AI067750/AI/NIAID NIH HHS/United States
- R56 AI067750/AI/NIAID NIH HHS/United States
- AR055695/AR/NIAMS NIH HHS/United States
- R01 AI067750/AI/NIAID NIH HHS/United States
LinkOut - more resources
Full Text Sources
Other Literature Sources
Research Materials


