Cotton GhMKK5 affects disease resistance, induces HR-like cell death, and reduces the tolerance to salt and drought stress in transgenic Nicotiana benthamiana - PubMed (original) (raw)
Cotton GhMKK5 affects disease resistance, induces HR-like cell death, and reduces the tolerance to salt and drought stress in transgenic Nicotiana benthamiana
Liang Zhang et al. J Exp Bot. 2012 Jun.
Abstract
Mitogen-activated protein kinase (MAPK) cascades are involved in various processes from plant growth and development to biotic and abiotic stress responses. MAPK kinases (MAPKKs), which link MAPKs and MAPKK kinases (MAPKKKs), play crucial roles in MAPK cascades to mediate a variety of stress responses in plants. However, few MAPKKs have been functionally characterized in cotton (Gossypium hirsutum). In this study, a novel gene, GhMKK5, from cotton belonging to the group C MAPKKs was isolated and characterized. The expression of GhMKK5 can be induced by pathogen infection, abiotic stresses, and multiple defence-related signal molecules. The overexpression of GhMKK5 in Nicotiana benthamiana enhanced the plants' resistance to the bacterial pathogen Ralstonia solanacearum by elevating the expression of pathogen resistance (PR) genes, including PR1a, PR2, PR4, PR5, and NPR1, but increased the plants' sensitivity to the oomycete pathogen Phytophthora parasitica var. nicotianae Tucker. Importantly, GhMKK5-overexpressing plants displayed markedly elevated expression of reactive oxygen species-related and cell death marker genes, such as NtRbohA and NtCDM, and resulted in hypersensitive response (HR)-like cell death characterized by the accumulation of H(2)O(2). Furthermore, it was demonstrated that GhMKK5 overexpression in plants reduced their tolerance to salt and drought stresses, as determined by statistical analysis of seed germination, root length, leaf water loss, and survival rate. Drought obviously accelerated the cell death phenomenon in GhMKK5-overexpressing plants. These results suggest that GhMKK5 may play an important role in pathogen infection and the regulation of the salt and drought stress responses in plants.
Figures
Fig. 1.
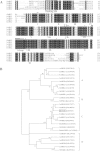
Comparison of the deduced amino acid sequences of GhMKK5 and closely related plant MAPKKs. (A) Alignment of the amino acid sequence of GhMKK5 (ADU545) with those of AtMKK4 (NP_175577), AtMKK5 (NP_188759), LeMKK2 (AAU04434), and NtMEK2 (BAE97401). Identical amino acids are shaded in black. The protein kinase subdomains are shown with numerals (I–XI) on the bottom of the sequences, and the activation loop (A-loop) is underlined. The serine and/or threonine residues in the conserved consensus motif S/TXXXXXS/T between subdomains VII and VIII of MAPKKs are marked with filled inverted triangles above. The conserved aspartate and lysine residues within the active site motif, -D(L/I/V)K-, are indicated by filled circles. The docking site is boxed. The asterisks above the sequences represent the putative substrate-binding sites. (B) The phylogenetic relationships between GhMKK5 and other plant MAPKK proteins. The Neighbor–Joining phylogenetic tree was created with Clustal W using MEGA 4.1. The numbers above or below branches indicate the bootstrap values (>50%) from 500 replicates. The gene name is followed by the protein ID. The species of origin of the MAPKKs are indicated by the abbreviation before the gene names: At, A. thaliana; Gh, Gossypium hirsutum; Le, Lycopersicon esculentum (Solanum lycopersicum); Ms, Medicago sativa; Nb, Nicotiana benthamiana; Nt, Nicotiana tabacum; Os, Oryza sativa; Pc, Petroselinum crispum, and Zm, Zea mays.
Fig. 2.
Comparison of the genomic DNA sequences of GhMKK5 and several MAPKK genes of Arabidopsis available in GenBank. The white boxes indicate the introns, and the grey boxes represent the exons. The scale indicates the length of the sequence. A, B, C, and D indicate the groups of MAPKKs.
Fig. 3.
Subcellular localization of the GhMKK5 protein in onion epidermal cells. (A) Schematic diagram of the 35S::GhMKK5–GFP fusion construct and the 35S::GFP construct. (B) Transient expression of 35S::GhMKK5–GFP fusion and 35S::GFP constructs in onion epidermal cells. Green fluorescence was observed 12 h after particle bombardment using a confocal microscope. The arrow indicates the nuclei. Bar=200 μm.
Fig. 4.
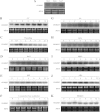
Expression profiles of GhMKK5 in different tissues and under different stress conditions. (A) Tissue-specific expression of GhMKK5 analysed by northern blot using the total RNA extracted from roots, stems, and cotyledon leaves of 7-day-old cotton seedlings. For stress treatments, 7-day-old cotton seedlings obtained from hydroponic culture were treated with low temperature (4 °C) (B), wounding (C), 200 mM NaCl (D), 10 μM MV (E), F. oxysporum f. sp. vasinfectum (F), 10 mM SA (G), 100 μM H2O2 (H), 100 μM MeJA (I), 100 μM ABA (J), and 5 mM ET released from ethephon (K). Total RNA was isolated at the indicated times after the treatments and was subjected to northern blot analysis using α-32P-labelled GhMKK5 cDNA fragments as a probe. The ethidium bromide (EB)-stained rRNA is included as a loading control. This experiment was repeated at least twice.
Fig. 5.
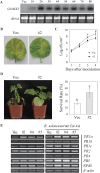
Overexpression of GhMKK5 conferred on transgenic plants enhanced resistance to bacterial pathogens. (A) Northern blot analysis of GhMKK5 expression in T1 OE and Vec plants. (B) Signs of disease of the detached leaves from OE (#2) and Vec plants inoculated with 20 μl of a suspension (OD600=0.6–0.8) of R. solanacearum. The inoculated leaves were maintained under greenhouse conditions with 80% relative humidity for 1 week, and photographs taken at day 4 are presented. (C) Bacterial growth in the leaves of Vec and #2 plants at different time points after infiltration with R. solanacearum. Data are the means ±SE of three independent experiments (_n_=6). Asterisks (*) above lines indicate significant differences (P < 0.05) according to Duncan’s multiple range test. (D) Disease signs and survival rates of the OE (#2) and Vec plants inoculated with R. solanacearum using the trickle irrigation method. Data are the means ±SE of three independent experiments (n ≥ 30). Different letters above the columns indicate significant differences (P < 0.05) according to Duncan’s multiple range test. (E) RT-PCR analysis of the expression of PR genes in OE (#2, #4, and #5) and Vec plants under normal and R. solanacearum inoculation conditions. OE, overexpression; Vec, vector control; #2, #4, #5, particular overexpressing lines.
Fig. 6.
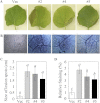
Overexpression of GhMKK5 conferred on transgenic plants enhanced susceptibility to P. parasitica infection. (A) Disease signs on the detached leaves of OE and Vec plants 6 d after inoculation. (B) Trypan blue staining for the pathogen infection. The average number of spores per cotyledon at 6 d after P. parasitica infection and the relative staining of trypan blue are shown in (C) and (D), respectively. Each experiment contained the spore counts from 10 inoculated cotyledons of OE and Vec plants. Data are the means ±SE of three independent experiments. Different letters above the columns indicate significant differences (P < 0.05), and different italic letters indicate highly significant differences (P < 0.01) according to Duncan’s multiple range test. (E) Disease signs of the transgenic plants inoculated with the P. parasitica pathogen using the trickle irrigation method. These plants’ survival rates are given in (F). Data are the means ±SE of three independent experiments (n ≥ 30). Different italic letters indicate highly significant differences (P < 0.01) according to Duncan’s multiple range test. OE, overexpression; Vec, vector control; #2, #4, #5, particular overexpressing lines.
Fig. 7.
The HR-like cell death in transgenic plants induced by the overexpression of GhMKK5. (A) HR-like cell death signs in the leaves of OE plants. (B) Trypan blue staining for cell death in the leaves of transgenic plants. (C) The size of lesions in the leaves with HR-like cell death. (D) The relative levels of staining for cell death in the leaves of transgenic plants. OE, overexpression. Data are the means ±SE of three independent experiments (_n_=15). Different italic letters indicate highly significant differences (P < 0.01) according to Duncan’s multiple range test. Vec, vector control; #2, #4, #5, particular overexpressing lines.
Fig. 8.
H2O2 generation induces cell death mediated by the overexpression of GhMKK5. (A) The accumulation of H2O2 in transgenic plants visualized by DAB staining. (B) The significant accumulation of H2O2 surrounding the necrotic lesions in #2 plants. The black box indicates the region containing the necrotic lesions. (C) The expression of ROS and cell death-related genes in transgenic plants under normal and R. solanacearum infection conditions. OE, overexpression; Vec, vector control. #2, #4, #5, particular overexpressing lines.
Fig. 9.
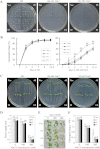
Reduced salt tolerance in transgenic plants overexpressing GhMKK5. (A) Seed germination in the presence of the indicated NaCl concentrations. (B) Germination rates of the OE and Vec lines under normal and NaCl treatment conditions. Germination was scored daily, and the result on the MS medium with 100 mM NaCl is presented. Data are the means ±SE of three independent experiments (_n_=3). Asterisks (* or **) above lines indicate (highly) significant differences (*P < 0.05; **P < 0.01) according to Duncan’s multiple range test. (C) The post-germination seedling development of OE and Vec lines on MS medium containing different concentrations of NaCl. The seeds sown on MS medium for 3 d with radicle emergence were transferred onto MS medium with different concentrations of NaCl. The plates were held erect, and a photograph was taken 14 d after transfer. (D) Root length of the seedlings 14 d after transfer onto NaCl-containing plates. Data are the means ±SE of three independent experiments (_n_=6). Different letters above the columns indicate significant differences (P < 0.05) according to Duncan’s multiple range test. (E) Leaf discs from OE and Vec plants were infiltrated with different concentrations of NaCl (0, 100, and 200 mM). (F) Relative chlorophyll content in the leaf disks 4 d after NaCl treatments. Data are the means ±SE of three independent experiments (_n_=6). Different letters above the columns indicate significant differences (P < 0.05), and different italic letters indicate a highly significant difference (P < 0.01) according to Duncan’s multiple range test. OE, overexpression; Vec, vector control. #2, #4, #5, particular overexpressing lines. (This figure is available in colour at JXB online.)
Fig. 10.
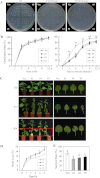
Reduced drought tolerance in _GhMKK5_-overexpressing plants. (A) Seed germination on MS medium in the presence of the indicated mannitol concentrations. (B) Germination rates of the OE and Vec lines under normal and 100 mM mannitol conditions. Data are the means ±SE of three independent experiments (_n_=3). Asterisks (**) above lines indicate highly significant differences (**P < 0.01) according to Duncan’s multiple range test. (C) Phenotype of plants submitted to drought stress at the vegetable stage. Water was withheld from 8-week-old plants for 10 d, and then the plants were watered for 2 d to allow them to recover. The leaves with drought-induced necrotic spots are shown on the right. BD, before drought treatment; RW, rewatering. (D) Water loss from detached leaves of OE and Vec plants. The rate of water loss was calculated by the loss in fresh weight of the samples. Data are the means ±SE of three independent experiments (_n_=6). Asterisks (*) above lines indicate significant differences (*P < 0.05) according to Duncan’s multiple range test. (E) The survival rate of the transgenic plants under drought conditions. Data are the means ±SE of three independent experiments (n ≥ 30). Different letters above the columns indicate significant differences (P < 0.05) according to Duncan’s multiple range test. OE, overexpression; Vec, vector control; #2, #4, #5, particular overexpressing lines. (This figure is available in colour at JXB online.)
Similar articles
- Overexpression of cotton GhMKK4 enhances disease susceptibility and affects abscisic acid, gibberellin and hydrogen peroxide signalling in transgenic Nicotiana benthamiana.
Li Y, Zhang L, Lu W, Wang X, Wu CA, Guo X. Li Y, et al. Mol Plant Pathol. 2014 Jan;15(1):94-108. doi: 10.1111/mpp.12067. Epub 2013 Aug 26. Mol Plant Pathol. 2014. PMID: 23980654 Free PMC article. - The Cotton Mitogen-Activated Protein Kinase Kinase 3 Functions in Drought Tolerance by Regulating Stomatal Responses and Root Growth.
Wang C, Lu W, He X, Wang F, Zhou Y, Guo X, Guo X. Wang C, et al. Plant Cell Physiol. 2016 Aug;57(8):1629-42. doi: 10.1093/pcp/pcw090. Epub 2016 May 6. Plant Cell Physiol. 2016. PMID: 27335349 - Expression of a wheat MYB gene in transgenic tobacco enhances resistance to Ralstonia solanacearum, and to drought and salt stresses.
Liu H, Zhou X, Dong N, Liu X, Zhang H, Zhang Z. Liu H, et al. Funct Integr Genomics. 2011 Sep;11(3):431-43. doi: 10.1007/s10142-011-0228-1. Epub 2011 May 20. Funct Integr Genomics. 2011. PMID: 21597961 - GhMPK7, a novel multiple stress-responsive cotton group C MAPK gene, has a role in broad spectrum disease resistance and plant development.
Shi J, An HL, Zhang L, Gao Z, Guo XQ. Shi J, et al. Plant Mol Biol. 2010 Sep;74(1-2):1-17. doi: 10.1007/s11103-010-9661-0. Epub 2010 Jul 3. Plant Mol Biol. 2010. PMID: 20602149 Review. - Role of WRKY Transcription Factors in Regulation of Abiotic Stress Responses in Cotton.
Guo X, Ullah A, Siuta D, Kukfisz B, Iqbal S. Guo X, et al. Life (Basel). 2022 Sep 9;12(9):1410. doi: 10.3390/life12091410. Life (Basel). 2022. PMID: 36143446 Free PMC article. Review.
Cited by
- Activation of disease resistance against Botryosphaeria dothidea by downregulating the expression of MdSYP121 in apple.
He X, Huo Y, Liu X, Zhou Q, Feng S, Shen X, Li B, Wu S, Chen X. He X, et al. Hortic Res. 2018 May 1;5:24. doi: 10.1038/s41438-018-0030-5. eCollection 2018. Hortic Res. 2018. PMID: 29736249 Free PMC article. - Transcriptome Sequencing in Response to Salicylic Acid in Salvia miltiorrhiza.
Zhang X, Dong J, Liu H, Wang J, Qi Y, Liang Z. Zhang X, et al. PLoS One. 2016 Jan 25;11(1):e0147849. doi: 10.1371/journal.pone.0147849. eCollection 2016. PLoS One. 2016. PMID: 26808150 Free PMC article. - Recent insights into cotton functional genomics: progress and future perspectives.
Ashraf J, Zuo D, Wang Q, Malik W, Zhang Y, Abid MA, Cheng H, Yang Q, Song G. Ashraf J, et al. Plant Biotechnol J. 2018 Mar;16(3):699-713. doi: 10.1111/pbi.12856. Epub 2018 Jan 15. Plant Biotechnol J. 2018. PMID: 29087016 Free PMC article. Review. - Overexpression of pathogen-induced grapevine TIR-NB-LRR gene VaRGA1 enhances disease resistance and drought and salt tolerance in Nicotiana benthamiana.
Li X, Zhang Y, Yin L, Lu J. Li X, et al. Protoplasma. 2017 Mar;254(2):957-969. doi: 10.1007/s00709-016-1005-8. Epub 2016 Jul 28. Protoplasma. 2017. PMID: 27468994
References
- Ahlfors R, Macioszek V, Rudd J, Brosche M, Schlichting R, Scheel D, Kangasjarvi J. Stress hormone-independent activation and nuclear translocation of mitogen-activated protein kinases in Arabidopsis thaliana during ozone exposure. The Plant Journal. 2004;40:512–522. - PubMed
- Andreasson E, Ellis B. Convergence and specificity in the Arabidopsis MAPK nexus. Trends in Plant Science. 2010;15:106–113. - PubMed
- Asai T, Tena G, Plotnikova J, Willmann MR, Chiu WL, Gomez-Gomez L, Boller T, Ausubel FM, Sheen J. MAP kinase signalling cascade in Arabidopsis innate immunity. Nature. 2002;415:977–983. - PubMed
- Brader G, Djamei A, Teige M, Palva ET, Hirt H. The MAP kinase kinase MKK2 affects disease resistance in Arabidopsis . Molecular Plant-Microbe Interactions. 2007;20:589–596. - PubMed
Publication types
MeSH terms
Substances
LinkOut - more resources
Full Text Sources
Research Materials
Miscellaneous
