Neurotoxin-induced ER stress in mouse dopaminergic neurons involves downregulation of TRPC1 and inhibition of AKT/mTOR signaling - PubMed (original) (raw)
. 2012 Apr;122(4):1354-67.
doi: 10.1172/JCI61332. Epub 2012 Mar 26.
Affiliations
- PMID: 22446186
- PMCID: PMC3314472
- DOI: 10.1172/JCI61332
Neurotoxin-induced ER stress in mouse dopaminergic neurons involves downregulation of TRPC1 and inhibition of AKT/mTOR signaling
Senthil Selvaraj et al. J Clin Invest. 2012 Apr.
Abstract
Individuals with Parkinson's disease (PD) experience a progressive decline in motor function as a result of selective loss of dopaminergic (DA) neurons in the substantia nigra. The mechanism(s) underlying the loss of DA neurons is not known. Here, we show that a neurotoxin that causes a disease that mimics PD upon administration to mice, because it induces the selective loss of DA neurons in the substantia nigra, alters Ca²⁺ homeostasis and induces ER stress. In a human neuroblastoma cell line, we found that endogenous store-operated Ca²⁺ entry (SOCE), which is critical for maintaining ER Ca²⁺ levels, is dependent on transient receptor potential channel 1 (TRPC1) activity. Neurotoxin treatment decreased TRPC1 expression, TRPC1 interaction with the SOCE modulator stromal interaction molecule 1 (STIM1), and Ca²⁺ entry into the cells. Overexpression of functional TRPC1 protected against neurotoxin-induced loss of SOCE, the associated decrease in ER Ca²⁺ levels, and the resultant unfolded protein response (UPR). In contrast, silencing of TRPC1 or STIM1 increased the UPR. Furthermore, Ca²⁺ entry via TRPC1 activated the AKT pathway, which has a known role in neuroprotection. Consistent with these in vitro data, Trpc1⁻/⁻ mice had an increased UPR and a reduced number of DA neurons. Brain lysates of patients with PD also showed an increased UPR and decreased TRPC1 levels. Importantly, overexpression of TRPC1 in mice restored AKT/mTOR signaling and increased DA neuron survival following neurotoxin administration. Overall, these results suggest that TRPC1 is involved in regulating Ca²⁺ homeostasis and inhibiting the UPR and thus contributes to neuronal survival.
Figures
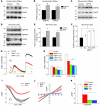
Figure 1. MPP+ induces ER Ca2+ depletion by attenuating SOCE, which causes ER stress.
(A) Representative blots from the SNpc region of postmortem human PD (n = 5) and age-matched controls (n = 4). (B) RNA was extracted, and RT-PCR was performed. Values represent mean ± SD from 3 independent experiments (*P < 0.05). (C) Mice received 25 mg/kg MPTP as described in ref. , and SNpc samples were removed, processed, and immunoblotted using the respective antibodies. (D) SH-SY5Y cells were treated with 500 μM MPP+, and cell lysates were resolved and analyzed by Western blotting. Antibodies are labeled; β-actin was used as loading control. (E) Quantification (mean ± SD) from 3 or more independent experiments. The OD of GRP78 and GRP94 was normalized to β-actin. (F) Cells transfected with the ERSE promoter were lysed after MPP+ treatment, and luciferase assays were performed. Values represent mean ± SD from 3 independent experiments (*P < 0.05). (G) Analog plots of the fluorescence ratio (340/380 nm) from an average of 30–40 cells in each condition. (H) Quantification (mean ± SEM) of 340/380 ratio. *P < 0.05 versus untreated. (I) Tg-induced currents (mean ± SEM) were evaluated in control and MPP+-treated (12 hours) cells. The holding potential for current recordings was –80 mV. (J) I-V curves (mean current ± SEM) under these conditions; the average (8–10 recordings) current intensity under various conditions is shown in K. *P < 0.05 compared with control; values are shown as mean ± SEM. SKF, SKF-96365.
Figure 2. TRPC1 mediates SOCE in SH-SY5Y cells, and MPP+ selectively decreases TRPC1 expression/function.
(A) SH-SY5Y cells were treated with MPP+ (500 μM) for 12 hours. RNA was extracted, and quantitative RT-PCR was performed. Values represent mean ± SD from at least 3 independent experiments. *P < 0.05 versus untreated control. TRPC1 was evaluated after 15 cycles, whereas other TRPCs required at least 25 cycles. (B) Cells were treated with vehicle control or MPP+ and lysed, and proteins were subjected to SDS-PAGE followed by Western blotting with the indicated antibodies. Membranes were reprobed with anti–β-actin antibody to confirm equal loading. (C) Quantification (mean ± SD) of individual proteins from 3 or more independent experiments. Relative expression of each individual proteins was normalized to β-actin. *P < 0.05 versus untreated control. (D and E) Immunoprecipitation with anti-STIM1 antibody of lysates from control or MPP+-treated cells with or without Tg. Immunoblotting was performed using anti-TRPC1, -Orai1, and -STIM1 antibodies. (E) Brain lysates from control and PD samples were subjected to SDS-PAGE and immunoblotted with the respective antibodies. (F) Paraffin-embedded sections of postmortem human SNpc samples obtained from control and PD patients were immunostained using TRPC1 and TH antibodies. Original magnification, ×40.
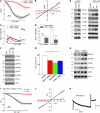
Figure 3. TRPC1 functions as an endogenous SOCE channel, and knockdown of TRPC1 induces ER stress.
(A) Tg-induced currents (mean ± SEM) were evaluated in control siRNA– and TRPC1 siRNA–transfected cells. The holding potential for the recordings was –80 mV, and an I-V curve (mean current ± SEM) under these conditions is shown in B. (C) Analog plots of the 340/380 ratio from an average of 40–60 cells are shown. (D) Quantification (mean ± SEM) of fluorescence ratio. *P < 0.05 versus untreated control; numbers of cells imaged are indicated. (E) SH-SY5Y cells were transfected with control siRNA or TRPC1 siRNA, or treated with 50 or 100 μM SKF-96365 for 24 hours. Cells were lysed, subjected to SDS-PAGE, and immunoblotted with the respective antibodies. (F) SH-SY5Y cells transfected with control or STIM1 siRNA were lysed and immunoblotted with respective antibodies. (G) MTT assay was performed in control, TRPC1 siRNA–transfected, SKF-96365–treated (100 μM for 24 hours), or STIM1 siRNA–transfected cells. Values represent mean ± SD from at least 3 independent experiments. *P < 0.05 versus control. (H) Tissue lysates from the SNpc region of wild-type and Trpc1–/– mice were subjected to SDS-PAGE and immunoblotted with the respective antibodies. (I and J) Endogenous currents (mean ± SEM) and relative I-V curves (mean currents ± SEM) upon Tg stimulation in DA neurons in the SNpc of Trpc1+/+ and Trpc1–/– mice. The currents shown were recorded at a holding potential of –70 mV. (K) DA neurons induced a large inward current by a hyperpolarizing pulse of 60 mV, indicating the electrical signature of DA neurons.
Figure 4. TRPC1 overexpression restores SOCE and attenuates ER stress.
(A) Tg-induced currents (at –80 mV, mean ± SEM) were evaluated in control and TRPC1-overexpressing SH-SY5Y cells. (B) Average (mean ± SEM from 7–9 recordings) current intensity under various conditions. (C) SH-SY5Y cells were treated with MPP+ for 12 hours with or without TRPC1 overexpression, and analog plots (mean ± SEM) of the fluorescence ratio (340/380 nm) are shown. Fluorescence ratio was measured in the presence of 2 μM Tg with and without 1 mM Ca2+. (D) Quantification (mean ± SEM) of fluorescence ratio; *P < 0.05 versus MPP+-treated cells. (E–G) TRPC1-, Orai1-, or TRPC1pm-overexpressing SH-SY5Y cells were treated with MPP+ for 12 hours, lysed, resolved, and subjected to Western blotting with the indicated antibodies. (H) Cell survival (MTT assay) under different conditions. Values are expressed as mean ± SD. *P < 0.05 versus MPP+-treated cells.
Figure 5. AKT modulation is crucial for TRPC1-mediated neuroprotection.
(A) Brain lysates from control and PD samples were immunoblotted with the respective antibodies. (B) Cells were treated with MPP+ (500 μM, 12 hours) with or without Ad-TRPC1, and Western blots were performed. For control, membranes were reprobed with anti-AKT1. (C) Relative expression of phospho-AKT1 (Ser473) is shown. Values are mean ± SD; *P < 0.05. (D) Cells were transfected with control vector or TRPC1pm (36 hours) and treated with MPP+ (500 μM) for 12 hours, lysed, and subjected to Western blotting with the indicated antibodies. (E) SH-SY5Y cells were treated with 5 μM Tg in SES buffer for 10 minutes with or without Ca2+ (2 mM), lysed, resolved using SDS-PAGE, and immunoblotted with AKT1 and phosphorylated AKT antibodies. (F) SH-SY5Y cells were treated with 5 μM Tg or 100 μM CCh for 15 minutes with or without pretreatment with SKF-96365 (50 μM, 45 minutes), processed, and probed with phospho-AKT1 (Ser473). Diagram shows the densitometric values of phospho-AKT1 (Ser473). Values are mean ± SEM. *P < 0.05 versus untreated controls. (G) SH-SY5Y cells were transfected with AKT1 siRNA and/or with Ad-TRPC1, followed by the addition of MPP+ (12 hours) and assayed for cell survival. Values represent mean ± SD from at least 3 independent experiments. *P < 0.05 versus untreated control. (H) SH-SY5Y cells were transfected with 50 pmol AKT1 siRNA, lysed after 36 hours, resolved, and immunoblotted with anti-AKT1 and anti–β-actin.
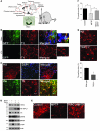
Figure 6. TRPC1 overexpression protects DA neuron in an in vivo MPTP model of PD.
(A) Graphic representation of intranigral injection protocol. (B and C) Unilateral injection of GFP or HA-TRPC1 adenovirus (3 × 10⁷ particles) into the SNpc (n = 6). Brain samples containing the SNpc region were sectioned (12 μm) and stained for TH immunofluorescence. Expression of GFP and TH in the SNpc and in ventral tegmental area (VTA) were evaluated. HA-TRPC1 colocalized with TH (C, bottom row). Scale bars in C: 20 μm. (D) HA-TRPC1 or GFP adenovirus was injected directly into the SNpc of animals (n = 6–8 per group) 7 days before MPTP treatment. After 1 week of MPTP injection, SNpc samples were removed and subjected to SDS-PAGE and immunoblotted with the respective antibodies. Control GFP virus–injected mice received an equal volume of saline. (E) Representative TH staining of the ipsilateral sides of animals injected with the indicated virus with and without MPTP. (F) Quantification of the number of TH-positive neurons from ipsilateral or contralateral sides for the indicated treatment groups. Data are mean ± SEM. *P < 0.05. (G) Brain samples containing the SNpc from wild-type and Trpc1–/– mice were sectioned (12 μm) and stained for TH. Quantification of TH-positive neurons is shown in the graph. Data are presented as mean ± SEM. *P < 0.05. Original magnification, ×40; magnified images in B, ×100.
Figure 7. TRPC1 overexpression activates the AKT/mTOR pathway in mice.
(A and B) SNpc regions were removed from control animals and animals overexpressing TRPC1 that had been treated or not with MPTP, and were subjected to SDS-PAGE and immunoblotting with the respective antibodies. Data are representative of 2–3 independent experiments. (C) Model for MPP+/MPTP-induced DA loss and TRPC1-mediated neuroprotection. MPP+/MPTP decreases the expression of TRPC1 and SOC-mediated Ca2+ influx either directly or indirectly via mitochondrial dysfunction. This leads to prolonged ER Ca2+ depletion and activation of the UPR and subsequent ER stress–mediated neurodegeneration. In contrast, TRPC1 overexpression restores SOCE function and maintains ER Ca2+ homeostasis. Further, Ca2+ influx through TRPC1 activates AKT/mTOR-mediated survival mechanisms in DA cells, which leads to increased neuronal survival.
Comment in
- Parkinson's disease: don't mess with calcium.
Mattson MP. Mattson MP. J Clin Invest. 2012 Apr;122(4):1195-8. doi: 10.1172/JCI62835. Epub 2012 Mar 26. J Clin Invest. 2012. PMID: 22446181 Free PMC article.
Similar articles
- Parkinson's disease: don't mess with calcium.
Mattson MP. Mattson MP. J Clin Invest. 2012 Apr;122(4):1195-8. doi: 10.1172/JCI62835. Epub 2012 Mar 26. J Clin Invest. 2012. PMID: 22446181 Free PMC article. - Inhibition of L-Type Ca2+ Channels by TRPC1-STIM1 Complex Is Essential for the Protection of Dopaminergic Neurons.
Sun Y, Zhang H, Selvaraj S, Sukumaran P, Lei S, Birnbaumer L, Singh BB. Sun Y, et al. J Neurosci. 2017 Mar 22;37(12):3364-3377. doi: 10.1523/JNEUROSCI.3010-16.2017. Epub 2017 Mar 3. J Neurosci. 2017. PMID: 28258168 Free PMC article. - Sigma1 Receptor Inhibits TRPC1-Mediated Ca2+ Entry That Promotes Dopaminergic Cell Death.
Sun Y, Sukumaran P, Singh BB. Sun Y, et al. Cell Mol Neurobiol. 2021 Aug;41(6):1245-1255. doi: 10.1007/s10571-020-00892-5. Epub 2020 Jun 9. Cell Mol Neurobiol. 2021. PMID: 32514827 - STIM-TRP Pathways and Microdomain Organization: Contribution of TRPC1 in Store-Operated Ca2+ Entry: Impact on Ca2+ Signaling and Cell Function.
Ong HL, Ambudkar IS. Ong HL, et al. Adv Exp Med Biol. 2017;993:159-188. doi: 10.1007/978-3-319-57732-6_9. Adv Exp Med Biol. 2017. PMID: 28900914 Review. - Contribution of TRPC1 and Orai1 to Ca(2+) entry activated by store depletion.
Cheng KT, Ong HL, Liu X, Ambudkar IS. Cheng KT, et al. Adv Exp Med Biol. 2011;704:435-49. doi: 10.1007/978-94-007-0265-3_24. Adv Exp Med Biol. 2011. PMID: 21290310 Free PMC article. Review.
Cited by
- STIM1 and STIM2 proteins differently regulate endogenous store-operated channels in HEK293 cells.
Shalygin A, Skopin A, Kalinina V, Zimina O, Glushankova L, Mozhayeva GN, Kaznacheyeva E. Shalygin A, et al. J Biol Chem. 2015 Feb 20;290(8):4717-4727. doi: 10.1074/jbc.M114.601856. Epub 2014 Dec 22. J Biol Chem. 2015. PMID: 25533457 Free PMC article. - Functional Importance of Transient Receptor Potential (TRP) Channels in Neurological Disorders.
Lee K, Jo YY, Chung G, Jung JH, Kim YH, Park CK. Lee K, et al. Front Cell Dev Biol. 2021 Mar 4;9:611773. doi: 10.3389/fcell.2021.611773. eCollection 2021. Front Cell Dev Biol. 2021. PMID: 33748103 Free PMC article. Review. - Strategies targeting endoplasmic reticulum stress to improve Parkinson's disease.
Wang D, Qu S, Zhang Z, Tan L, Chen X, Zhong HJ, Chong CM. Wang D, et al. Front Pharmacol. 2023 Nov 10;14:1288894. doi: 10.3389/fphar.2023.1288894. eCollection 2023. Front Pharmacol. 2023. PMID: 38026955 Free PMC article. Review. - Loss of Ca2+ entry via Orai-TRPC1 induces ER stress, initiating immune activation in macrophages.
Nascimento Da Conceicao V, Sun Y, Zboril EK, De la Chapa JJ, Singh BB. Nascimento Da Conceicao V, et al. J Cell Sci. 2019 Dec 18;133(5):jcs237610. doi: 10.1242/jcs.237610. J Cell Sci. 2019. PMID: 31722977 Free PMC article. - The Interaction of mTOR and Nrf2 in Neurogenesis and Its Implication in Neurodegenerative Diseases.
Zoungrana LI, Krause-Hauch M, Wang H, Fatmi MK, Bates L, Li Z, Kulkarni P, Ren D, Li J. Zoungrana LI, et al. Cells. 2022 Jun 28;11(13):2048. doi: 10.3390/cells11132048. Cells. 2022. PMID: 35805130 Free PMC article. Review.
References
Publication types
MeSH terms
Substances
Grants and funding
- R01 DE017102/DE/NIDCR NIH HHS/United States
- P50 NS053488/NS/NINDS NIH HHS/United States
- P50 NS-053488/NS/NINDS NIH HHS/United States
- DE017102/DE/NIDCR NIH HHS/United States
- P20 RR017699/RR/NCRR NIH HHS/United States
- Z01 ES101684/Intramural NIH HHS/United States
- 5P20RR017699/RR/NCRR NIH HHS/United States
LinkOut - more resources
Full Text Sources
Other Literature Sources
Molecular Biology Databases
Miscellaneous


