HIF1α induced switch from bivalent to exclusively glycolytic metabolism during ESC-to-EpiSC/hESC transition - PubMed (original) (raw)
HIF1α induced switch from bivalent to exclusively glycolytic metabolism during ESC-to-EpiSC/hESC transition
Wenyu Zhou et al. EMBO J. 2012.
Abstract
The function of metabolic state in stemness is poorly understood. Mouse embryonic stem cells (ESC) and epiblast stem cells (EpiSC) are at distinct pluripotent states representing the inner cell mass (ICM) and epiblast embryos. Human embryonic stem cells (hESC) are similar to EpiSC stage. We now show a dramatic metabolic difference between these two stages. EpiSC/hESC are highly glycolytic, while ESC are bivalent in their energy production, dynamically switching from glycolysis to mitochondrial respiration on demand. Despite having a more developed and expanding mitochondrial content, EpiSC/hESC have low mitochondrial respiratory capacity due to low cytochrome c oxidase (COX) expression. Similarly, in vivo epiblasts suppress COX levels. These data reveal EpiSC/hESC functional similarity to the glycolytic phenotype in cancer (Warburg effect). We further show that hypoxia-inducible factor 1α (HIF1α) is sufficient to drive ESC to a glycolytic Activin/Nodal-dependent EpiSC-like stage. This metabolic switch during early stem-cell development may be deterministic.
Conflict of interest statement
The authors declare that they have no conflict of interest.
Figures
Figure 1
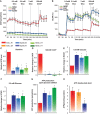
EpiSC and hESC show similar metabolic profiles. EpiSC and hESC have lower mitochondrial respiration activity and higher glycolytic rate than ESC. Oxygen consumption rate (OCR) (A, C, D) and extracellular acidification rate (ECAR) (B, E, F) measured in SeaHorse Extracellular Flux assay are shown. To test energetic preference when glucose is present, 0.5 mM glucose, 2.5, 7 mM glucose and 500 nM CCCP, a mitochondria uncoupler, were injected during the experiment with the same time intervals; (A) and (B) are traces from a representative SeaHorse run. (G) ATP production was calculated directly from OCR and ECAR measured in SeaHorse assay following ATP produced=OCR × time course × 5+ECAR × time course. (H) ESC have higher ATP content as the steady-state level than EpiSC. Results were summarized from at least three independent biological experiments, each consisting of independent cell plating on five SeaHorse microplate wells. The error bars represented the standard error of the mean, as calculated by sample standard deviation divided by the square root of the sample size. *Indicates P<0.05.
Figure 2
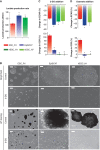
EpiSC are highly glycolytic compared with ESC. (A) EpiSC produce higher level of lactate, indicative of higher pyruvate generated through glycolysis. (B) ESC retain pluripotency in the presence of 2-deoxyglucose (2-DG), while EpiSC and hESC die upon 2-DG addition; Images for both bright fields and alkaline phosphatase (AP) staining are shown. (C) 2-DG results in higher ECAR reduction but lower OCR increase in EpiSC and hESC than in ESC, confirming the high glycolysis and low mitochondria reserve present in EpiSC. (D) The addition of Oxamate, an inhibitor of lactate dehydrogenase, results in higher ECAR reduction but lower OCR increase in EpiSC and hESC than in ESC, confirming the high glycolysis and low mitochondria reserve present in EpiSC. We did not observe differential expression of glucose transporters with significant trend in EpiSC compared with ESC (Supplementary Table 5), suggesting that the difference in glycolytic activity between EpiSC and ESC is not caused by glucose transporters levels. Results were summarized from two independent experiments, each consisting of independent cell plating on five SeaHorse microplate wells. The error bars represented the standard error of the mean.*Indicates P<0.05.
Figure 3
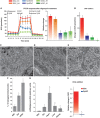
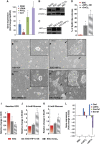
Lower mitochondrial respiration in EpiSC, compared with ESC, is not due to mitochondrial immaturity, low mitochondria number or lack of pyruvate accessibility to mitochondria. (A) The differences in OCR between ESC, EpiSC and hESC were abolished when oligomycin was present, confirming that the difference in the aerobic respiration was caused by difference in the oxidative phosphorylation. FCCP treatment following oligomycin resulted in higher OCR increase in ESC than in EpiSC and hESC, confirming the higher level of mitochondrial electron transport chain (ETC) activity in ESC. (B) Another mitochondrial uncoupler 2,4-DNP confirms that EpiSC and hESC have lower mitochondrial activity. Results were summarized from two independent experiments, and the error bars represented the standard error of the mean. (C–F) Electron microscopy shows that EpiSC and hESC contain more elongated mitochondria than ESC; 20 EM images containing 194 and 296 mitochondria were used, respectively, for ESC and EpiSC mitochondrial quantification, and 30 images containing 212 mitochondria were used for hESC mitochondrial quantification. (G) EpiSC and hESC have higher mitochondrial DNA copy number than ESC. (H) ESC but not EpiSC increase OCR in response to DCA. SeaHorse results were summarized from two independent experiments, each consisting of independent cell plating on five SeaHorse microplate wells. The error bars represented the standard error of the mean. *Indicates_P_<0.05.
Figure 4
Expression of nuclear-encoded mitochondrial IV COX genes is lower in EpiSC compared with ESC, resulting in lower complex IV activity in EpiSC. (A) EpiSC have lower mitochondrial membrane potential than ESC and MEFs measured by TMRM staining. (B) Heatmap of microarray expression data of mitochondrial complex IV COX gene cluster is shown, where EpiSC clearly demonstrate lower expression in these genes than ESC. (C) Validation of Cox8c, Cox6b2, Cox7a1 and_NqoI_ by quantitative PCR assays. (D) Complex IV isolated from EpiSC or hESC (H1 and H7 lines) shows lower activity _in vitro_than that of ESC; the activity of Complex IV isolated from MEFs is shown as comparison. (E) Potential regulators involved in mitochondria respiration, SCO2, PGC-1β and Esrrb, express at lower levels in EpiSC. Results were summarized from three independent biological samples, and the error bars represented the standard error of the mean.*Indicates P<0.05,** indicates P<0.01.
Figure 5
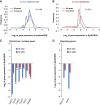
Deep RNA-sequence analysis of freshly dissected inner cell mass and epiblast reveals high similarity in mitochondrial COX gene expressions in vivo_and in vitro. Expression levels of COX genes only are compared with that of all genes in the in-vivo data set (A) and in the_in-vitro data set (B) to illustrate the downregulation of COX genes (in vivo: P<0.05; in vitro:P<0.01). (C) The comparison of the most significantly downregulated COX genes in-vivo and in-vitro data is shown. (D) High correlation of in-vivo and in-vitro data in the expression levels of PGC-1β and Esrrb is shown. Biological triplicates were used for each embryonic stage, the lysate comprised ∼50 embryos in each experiment. *Indicates_P_<0.05, ** indicates_P_<0.01.
Figure 6
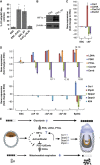
HIF signature is present in EpiSC as glycolysis regulator. (A)PDK1, LDHA and PYGL that are involved in glycolysis and also HIF targets are expressed at higher levels in EpiSC; Cer1 is expected to increase in EpiSC and used in comparison. Quantitative PCR validation is shown. (B) EpiSC expresses HIF1α protein under 21 O2, while little expression is shown in ESC. (C) HIF1α expression is confirmed in ESC treated with CoCl2 and HIF1α viral expression. (D–H) HIF1α overexpressing ESC transiently for 3 days (ESC+HIF1α and ESC+CoCl2D3) form flat monolayer EpiSC-like colonies (shown by arrow), which are not present in control ESC (ESC+EV empty vector and ESC+DMSO); the normal-looking ESC labelled by stars and quantification of the percentage of EpiSC-like colonies are shown; ESC+HIF1α and ESC+CoCl2 are metabolically different from ESC by having (I) lower baseline OCR and higher ECAR increase upon both 0.5 mM glucose (J) and 2.5 mM glucose addition (K), resembling EpiSC. (L) Significant changes resembling EpiSC in Cer1, LDHA, Cox7a1 and Esrrb expression were observed in ESC+HIF1α and ESC+CoCl2. Results were summarized from two independent experiments, each consisting of independent cell plating on five SeaHorse microplate wells. The error bars represented the standard error of the mean. *Indicates_P_<0.05.
Figure 7
(A) Quantification of the percentage of EpiSC-like colonies in ESC, ESC+CoCl2, ESC+Activin and ESC+CoCl2+ALKi shows that Activin/Nodal signalling is required for CoCl2 induced ESC-to-EpiSC transition. (B) ESC+Activin express HIF1α as confirmed by western blot. (C) Significant changes resembling EpiSC in LDHA,Cox7a1 and Esrrb expression were observed in ESC+Activin. (D) Expression kinetics are shown for key metabolic genes (LDHA, PDK1, PYGL, Cox7a1 and_Esrrb_) and lineage-related genes (Cer1, Zfp42,Dppa2, Dppa3 and Klf4) in ESC-to-EpiSC transition induced by Activin and FGF in culture, microarray from Hayashi _et al_was examined. (E) Illustration of the regulatory network in the metabolic transition from ESC to EpiSC: higher HIF activity in EpiSC increases glycolysis. HIF downregulates PGC-1β expression, reducing COX expression and ultimately resulting in a low mitochondrial respiration in EpiSC.
Similar articles
- Metabolic Maturation of Human Pluripotent Stem Cell-Derived Cardiomyocytes by Inhibition of HIF1α and LDHA.
Hu D, Linders A, Yamak A, Correia C, Kijlstra JD, Garakani A, Xiao L, Milan DJ, van der Meer P, Serra M, Alves PM, Domian IJ. Hu D, et al. Circ Res. 2018 Oct 12;123(9):1066-1079. doi: 10.1161/CIRCRESAHA.118.313249. Circ Res. 2018. PMID: 30355156 Free PMC article. - Efficient derivation of bovine embryonic stem cells needs more than active core pluripotency factors.
Maruotti J, Muñoz M, Degrelle SA, Gómez E, Louet C, Díez C, de Longchamp PH, Brochard V, Hue I, Caamaño JN, Jouneau A. Maruotti J, et al. Mol Reprod Dev. 2012 Jul;79(7):461-77. doi: 10.1002/mrd.22051. Epub 2012 May 31. Mol Reprod Dev. 2012. PMID: 22573702 - Reduced oxygen concentration enhances conversion of embryonic stem cells to epiblast stem cells.
Takehara T, Teramura T, Onodera Y, Hamanishi C, Fukuda K. Takehara T, et al. Stem Cells Dev. 2012 May 20;21(8):1239-49. doi: 10.1089/scd.2011.0322. Epub 2011 Oct 18. Stem Cells Dev. 2012. PMID: 21861689 - Generating primed pluripotent epiblast stem cells: A methodology chapter.
Samanta M, Kalantry S. Samanta M, et al. Curr Top Dev Biol. 2020;138:139-174. doi: 10.1016/bs.ctdb.2020.01.005. Epub 2020 Feb 27. Curr Top Dev Biol. 2020. PMID: 32220296 Free PMC article. Review. - HIF-1alpha modulates energy metabolism in cancer cells by inducing over-expression of specific glycolytic isoforms.
Marín-Hernández A, Gallardo-Pérez JC, Ralph SJ, Rodríguez-Enríquez S, Moreno-Sánchez R. Marín-Hernández A, et al. Mini Rev Med Chem. 2009 Aug;9(9):1084-101. doi: 10.2174/138955709788922610. Mini Rev Med Chem. 2009. PMID: 19689405 Review.
Cited by
- Role of nitric oxide in the maintenance of pluripotency and regulation of the hypoxia response in stem cells.
Beltran-Povea A, Caballano-Infantes E, Salguero-Aranda C, Martín F, Soria B, Bedoya FJ, Tejedo JR, Cahuana GM. Beltran-Povea A, et al. World J Stem Cells. 2015 Apr 26;7(3):605-17. doi: 10.4252/wjsc.v7.i3.605. World J Stem Cells. 2015. PMID: 25914767 Free PMC article. Review. - Tissue mechanics in stem cell fate, development, and cancer.
Hayward MK, Muncie JM, Weaver VM. Hayward MK, et al. Dev Cell. 2021 Jul 12;56(13):1833-1847. doi: 10.1016/j.devcel.2021.05.011. Epub 2021 Jun 8. Dev Cell. 2021. PMID: 34107299 Free PMC article. Review. - Metabolic Requirements for Spermatogonial Stem Cell Establishment and Maintenance In Vivo and In Vitro.
Voigt AL, Thiageswaran S, de Lima E Martins Lara N, Dobrinski I. Voigt AL, et al. Int J Mol Sci. 2021 Feb 18;22(4):1998. doi: 10.3390/ijms22041998. Int J Mol Sci. 2021. PMID: 33670439 Free PMC article. Review. - Hypoxia Induces a Metabolic Shift and Enhances the Stemness and Expansion of Cochlear Spiral Ganglion Stem/Progenitor Cells.
Chen HC, Lee JT, Shih CP, Chao TT, Sytwu HK, Li SL, Fang MC, Chen HK, Lin YC, Kuo CY, Wang CH. Chen HC, et al. Biomed Res Int. 2015;2015:359537. doi: 10.1155/2015/359537. Epub 2015 Jul 5. Biomed Res Int. 2015. PMID: 26236724 Free PMC article. - Dichloroacetate, the Pyruvate Dehydrogenase Complex and the Modulation of mESC Pluripotency.
Rodrigues AS, Correia M, Gomes A, Pereira SL, Perestrelo T, Sousa MI, Ramalho-Santos J. Rodrigues AS, et al. PLoS One. 2015 Jul 6;10(7):e0131663. doi: 10.1371/journal.pone.0131663. eCollection 2015. PLoS One. 2015. PMID: 26147621 Free PMC article.
References
- Bendall SC, Stewart MH, Menendez P, George D, Vijayaragavan K, Werbowetski-Ogilvie T, Ramos-Mejia V, Rouleau A, Yang J, Bosse M, Lajoie G, Bhatia M (2007) IGF and FGF cooperatively establish the regulatory stem cell niche of pluripotent human cells in vitro. Nature 448: 1015–1021 - PubMed
- Bertoni-Freddari C, Fattoretti P, Giorgetti B, Solazzi M, Balietti M, Casoli T, Di Stefano G (2004) Cytochrome oxidase activity in hippocampal synaptic mitochondria during aging: a quantitative cytochemical investigation. Ann NY Acad Sci 1019: 33–36 - PubMed
- Brons IG, Smithers LE, Trotter MW, Rugg-Gunn P, Sun B, Chuva de Sousa Lopes SM, Howlett SK, Clarkson A, Ahrlund-Richter L, Pedersen RA, Vallier L (2007) Derivation of pluripotent epiblast stem cells from mammalian embryos. Nature 448: 191–195 - PubMed
Publication types
MeSH terms
Substances
Grants and funding
- P30 DK056465-11S2/DK/NIDDK NIH HHS/United States
- R01DK078340/DK/NIDDK NIH HHS/United States
- DK17047/DK/NIDDK NIH HHS/United States
- R01GM083867/GM/NIGMS NIH HHS/United States
- R01 GM097372/GM/NIGMS NIH HHS/United States
- R01 GM083867/GM/NIGMS NIH HHS/United States
- P30 DK056465/DK/NIDDK NIH HHS/United States
- R01 DK078340/DK/NIDDK NIH HHS/United States
- P01 GM081619/GM/NIGMS NIH HHS/United States
- 1P01GM081619/GM/NIGMS NIH HHS/United States
- P30 DK017047/DK/NIDDK NIH HHS/United States
LinkOut - more resources
Full Text Sources
Other Literature Sources
Research Materials
