Genetics of gene expression in primary immune cells identifies cell type-specific master regulators and roles of HLA alleles - PubMed (original) (raw)
Genetics of gene expression in primary immune cells identifies cell type-specific master regulators and roles of HLA alleles
Benjamin P Fairfax et al. Nat Genet. 2012.
Abstract
Trans-acting genetic variants have a substantial, albeit poorly characterized, role in the heritable determination of gene expression. Using paired purified primary monocytes and B cells, we identify new predominantly cell type-specific cis and trans expression quantitative trait loci (eQTLs), including multi-locus trans associations to LYZ and KLF4 in monocytes and B cells, respectively. Additionally, we observe a B cell-specific trans association of rs11171739 at 12q13.2, a known autoimmune disease locus, with IP6K2 (P = 5.8 × 10(-15)), PRIC285 (P = 3.0 × 10(-10)) and an upstream region of CDKN1A (P = 2 × 10(-52)), suggesting roles for cell cycle regulation and peroxisome proliferator-activated receptor γ (PPARγ) signaling in autoimmune pathogenesis. We also find that specific human leukocyte antigen (HLA) alleles form trans associations with the expression of AOAH and ARHGAP24 in monocytes but not in B cells. In summary, we show that mapping gene expression in defined primary cell populations identifies new cell type-specific trans-regulated networks and provides insights into the genetic basis of disease susceptibility.
Figures
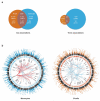
Figure 1. Shared and cell–specific cis and trans associations in B-cells and monocytes
(a) Venn diagrams illustrating the number of eSNPs unique to each cell subset and shared between datasets in cis (left panel) and in trans. B-cell data depicted in orange, monocyte in blue. (b) Circos plots for monocyte dataset (left panel) and B-cell dataset. From outside rim inwards: The outermost rim depicts a Manhattan plot for eQTLs from the respective dataset, the second rim depicts relative expression of genes, the third rim depicts an arbitrary selection of genes (constrained due to space) with significant trans-eQTLs (p<1×10⁻¹¹) and the innermost network depicts ‘spokes’ between nodal eSNPs and their trans-regulated genes. Such nodal eSNPs include rs10784774 which marks a monocyte specific master-regulatory region while rs10816519 identifies a B-cell specific master regulatory region. Red spokes: > 10 eSNPs from this locus map to the trans-eQTLs, blue spokes: >1 and <10, grey spokes: 1 eSNP.
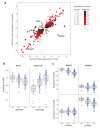
Figure 2. eSNPs shared between cell-types may lead to opposing directional effects on gene expression or associate with expression of different genes in a cell-specific manner
(a) Using eSNPs shared between cell types the most significant eSNP per probe is plotted with the fold change in expression this eSNP causes in homozygous form between major and minor alleles (fold-change monocytes y- axis, B-cells x-axis). Whilst the majority of eSNPs shared between datasets cause the same directional change, there are examples of eSNPs that cause opposing directional changes in expression dependent upon cell-type. Only one eSNP is plotted per probe and only eSNPs with examples of >2 individuals homozygous in the minor allele with permuted p<0.001 in both B-cells and monocyte datasets are annotated. (b) rs2223286 is associated with profound directional effects in the expression of SELL dependent upon genotype, with the minor C allele associated with increased expression of SELL in B-cells and reduced expression of SELL in monocytes (pB-cell=4.6×10⁻¹¹, pmonocyte=1.1×10⁻²²). (c) rs738289 is an example of an eSNP that forms eQTL to differing genes dependent upon cell type. In B-cells this eSNP is strongly associated with the expression of MGAT3 (pB-cell= 9.8×10⁻²⁶) with no association to SYNGR1 expression; whilst in monocytes this eSNP is significantly associated with the expression of SYNGR1 (pmonocyte = 1.2×10⁻¹⁷) with no association to MGAT3 expression.
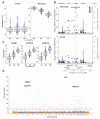
Figure 3. rs10784774 marks a monocyte specific cis-eSNP to LYZ and forms a monocyte specific master regulator of multiple genes including CREB1
(a & b) rs10784774 is significantly associated with the expression of a probe mapping to the 3′UTR of LYZ, encoding lysozyme, in monocytes only (p 78 B-cell N.S., pmonocyte=8.9×10−78). (c) rs10784774 additionally forms an eSNP to 72 probes mapping across the genome, the most significantly associated being in the genes CREB1(p = 2.0×10−67), DUSP19 (p = 2.2×10−59), and RAB27A (p = 2.0×10−57). (d) Manhattan plot demonstrating chromosomal location of all genes with probes mapping to rs10784774. The blue line represents 1.0×10⁻¹¹, red line 5.0×10⁻⁸.
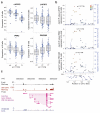
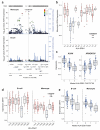
Figure 4. rs11171739, a SNP at 12q13.2 with strong autoimmune association forms B-cell specific trans-eQTL to 3 separate genes
(a) rs11171739 specifically associates with the B-cell trans expression of the genes LAP3P2 (pB-cell=2.0×10−52, pmonocyte=1.7×10⁻⁴), IP6K2 (pB-cell =5.8×10⁻¹⁵) and PRIC285 (pB-cell=3.0×10⁻¹⁰). (b) B-cell regional association plots of these genes demonstrating their expression by SNP marker across chromosome 12q13.2, a known autoimmune risk locus. (c) LAP3P2 lies ~1kb 5′ to CDKN1A and is denoted as a pseudogene. We observe a high degree of transcriptional activity in our RNA-seq data from CD19+ primary B-cells, and this is also seen in LCLs (GM12878). This region is highly conserved amongst vertebrates.
Figure 5. Imputation of HLA status resolves cell-specific trans-associated gene expression to carriage of specific classical HLA alleles
(a) Regional association plots from monocyte and B-cell data demonstrating the monocyte specific trans association of the chromosome 7 gene AOAH, to the class II MHC gene HLA-DRB1. There is no association in B-cell dataset, whilst the peak eSNP from monocyte dataset is rs28366298 (pmonocyte=1.6×10−43). (b) Imputation of class II alleles to 2 digit resolution demonstrates that the C allele of rs28366298 is specific to DRB1 *04, *07 and *09 alleles and these alleles are associated with reduced AOAH expression. For clarity only homozygotes are plotted with two AOAH expression values per individual (corresponding to each DRB allele) are displayed. (c) The number of DRB1 *04/*07/*09 alleles carried by an individual is significantly associated with reduced expression of AOAH (pB-cell <2.2×10⁻¹⁶, one-way ANOVA) and increased expression of ARHGAP24 (pmonocyte=3.0×10⁻¹⁴, one-way ANOVA). (d) Imputation of DQA1 status to 4 digits demonstrates that the G allele of rs35265698 is significantly associated with reduced expression of DEF8 in both B-cells and monocytes (pB-cell=6.2×10⁻¹³, pmonocyte=9.0×10⁻¹⁷). This allele is unique to DQA1*0301 as illustrated. For clarity only homozygotes of rs35265698 are plotted with two DEF8 expression values per individual (corresponding to each DQA allele) displayed. (e) Higher numbers of DQA1*0301 alleles possessed by an individual is significantly associated with reduced DEF8 expression (pB-cell=6.2×10⁻¹³, pmonocyte <2.2×10⁻¹⁶)
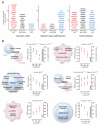
Figure 6. Cell specific cis-eQTL involving SNP markers associated with disease
Genes showing significant cis-eQTL that involve SNPs reported at genome-wide significance (p < 5×10⁻⁸) in the Catalog of Published Genome-Wide Association Studies (
www.genome.gov/GWA studies
) (accessed 10th September 2011) or proxy SNPs identified for these disease markers from the 1000 Genomes Project (CEU cohort, r2 > 0.8) are shown. (a) List of genes with shared cis-eQTL/GWAS SNPs for UC, SLE and CD grouped by cell type and excluding HLA genes. Specific examples are described further in Supplementary Information. (b) Examples of genes showing eQTL involving SNPs associated with multiple GWAS traits.
Comment in
- Cell type-specific eQTLs in the human immune system.
Gregersen PK. Gregersen PK. Nat Genet. 2012 Apr 26;44(5):478-80. doi: 10.1038/ng.2258. Nat Genet. 2012. PMID: 22538719
Similar articles
- Cell type-specific eQTLs in the human immune system.
Gregersen PK. Gregersen PK. Nat Genet. 2012 Apr 26;44(5):478-80. doi: 10.1038/ng.2258. Nat Genet. 2012. PMID: 22538719 - Integrating genome-wide genetic variations and monocyte expression data reveals trans-regulated gene modules in humans.
Rotival M, Zeller T, Wild PS, Maouche S, Szymczak S, Schillert A, Castagné R, Deiseroth A, Proust C, Brocheton J, Godefroy T, Perret C, Germain M, Eleftheriadis M, Sinning CR, Schnabel RB, Lubos E, Lackner KJ, Rossmann H, Münzel T, Rendon A; Cardiogenics Consortium; Erdmann J, Deloukas P, Hengstenberg C, Diemert P, Montalescot G, Ouwehand WH, Samani NJ, Schunkert H, Tregouet DA, Ziegler A, Goodall AH, Cambien F, Tiret L, Blankenberg S. Rotival M, et al. PLoS Genet. 2011 Dec;7(12):e1002367. doi: 10.1371/journal.pgen.1002367. Epub 2011 Dec 1. PLoS Genet. 2011. PMID: 22144904 Free PMC article. - Trans-eQTLs reveal that independent genetic variants associated with a complex phenotype converge on intermediate genes, with a major role for the HLA.
Fehrmann RS, Jansen RC, Veldink JH, Westra HJ, Arends D, Bonder MJ, Fu J, Deelen P, Groen HJ, Smolonska A, Weersma RK, Hofstra RM, Buurman WA, Rensen S, Wolfs MG, Platteel M, Zhernakova A, Elbers CC, Festen EM, Trynka G, Hofker MH, Saris CG, Ophoff RA, van den Berg LH, van Heel DA, Wijmenga C, Te Meerman GJ, Franke L. Fehrmann RS, et al. PLoS Genet. 2011 Aug;7(8):e1002197. doi: 10.1371/journal.pgen.1002197. Epub 2011 Aug 4. PLoS Genet. 2011. PMID: 21829388 Free PMC article. - Multiplex HLA-typing by pyrosequencing.
Lu Y, Boehm J, Nichol L, Trucco M, Ringquist S. Lu Y, et al. Methods Mol Biol. 2009;496:89-114. doi: 10.1007/978-1-59745-553-4_8. Methods Mol Biol. 2009. PMID: 18839107 Review. - Review of recent genome-wide association scans in lupus.
Graham RR, Hom G, Ortmann W, Behrens TW. Graham RR, et al. J Intern Med. 2009 Jun;265(6):680-8. doi: 10.1111/j.1365-2796.2009.02096.x. J Intern Med. 2009. PMID: 19493061 Review.
Cited by
- Genetics of ANCA-associated vasculitis in Japan: a role for HLA-DRB1*09:01 haplotype.
Tsuchiya N. Tsuchiya N. Clin Exp Nephrol. 2013 Oct;17(5):628-630. doi: 10.1007/s10157-012-0691-6. Epub 2012 Nov 23. Clin Exp Nephrol. 2013. PMID: 23180035 Review. - Immunoseq: the identification of functionally relevant variants through targeted capture and sequencing of active regulatory regions in human immune cells.
Morin A, Kwan T, Ge B, Letourneau L, Ban M, Tandre K, Caron M, Sandling JK, Carlsson J, Bourque G, Laprise C, Montpetit A, Syvanen AC, Ronnblom L, Sawcer SJ, Lathrop MG, Pastinen T. Morin A, et al. BMC Med Genomics. 2016 Sep 13;9(1):59. doi: 10.1186/s12920-016-0220-7. BMC Med Genomics. 2016. PMID: 27624058 Free PMC article. - Identification of new susceptibility loci for IgA nephropathy in Han Chinese.
Li M, Foo JN, Wang JQ, Low HQ, Tang XQ, Toh KY, Yin PR, Khor CC, Goh YF, Irwan ID, Xu RC, Andiappan AK, Bei JX, Rotzschke O, Chen MH, Cheng CY, Sun LD, Jiang GR, Wong TY, Lin HL, Aung T, Liao YH, Saw SM, Ye K, Ebstein RP, Chen QK, Shi W, Chew SH, Chen J, Zhang FR, Li SP, Xu G, Shyong Tai E, Wang L, Chen N, Zhang XJ, Zeng YX, Zhang H, Liu ZH, Yu XQ, Liu JJ. Li M, et al. Nat Commun. 2015 Jun 1;6:7270. doi: 10.1038/ncomms8270. Nat Commun. 2015. PMID: 26028593 Free PMC article. - Exploiting gene expression variation to capture gene-environment interactions for disease.
Idaghdour Y, Awadalla P. Idaghdour Y, et al. Front Genet. 2013 May 31;3:228. doi: 10.3389/fgene.2012.00228. eCollection 2012. Front Genet. 2013. PMID: 23755064 Free PMC article. - Persistently active microbial molecules prolong innate immune tolerance in vivo.
Lu M, Varley AW, Munford RS. Lu M, et al. PLoS Pathog. 2013 May;9(5):e1003339. doi: 10.1371/journal.ppat.1003339. Epub 2013 May 9. PLoS Pathog. 2013. PMID: 23675296 Free PMC article.
References
Publication types
MeSH terms
Substances
Grants and funding
- 281824/ERC_/European Research Council/International
- 075491/Z/04/WT_/Wellcome Trust/United Kingdom
- 439/DH_/Department of Health/United Kingdom
- 074318/WT_/Wellcome Trust/United Kingdom
- 090532/WT_/Wellcome Trust/United Kingdom
- WT_/Wellcome Trust/United Kingdom
- 088891/WT_/Wellcome Trust/United Kingdom
LinkOut - more resources
Full Text Sources
Other Literature Sources
Molecular Biology Databases
Research Materials
