Imaging the material properties of bone specimens using reflection-based infrared microspectroscopy - PubMed (original) (raw)
. 2012 Apr 17;84(8):3607-13.
doi: 10.1021/ac203375d. Epub 2012 Apr 4.
Affiliations
- PMID: 22455306
- PMCID: PMC3364542
- DOI: 10.1021/ac203375d
Imaging the material properties of bone specimens using reflection-based infrared microspectroscopy
Alvin S Acerbo et al. Anal Chem. 2012.
Abstract
Fourier transform infrared microspectroscopy (FTIRM) is a widely used method for mapping the material properties of bone and other mineralized tissues, including mineralization, crystallinity, carbonate substitution, and collagen cross-linking. This technique is traditionally performed in a transmission-based geometry, which requires the preparation of plastic-embedded thin sections, limiting its functionality. Here, we theoretically and empirically demonstrate the development of reflection-based FTIRM as an alternative to the widely adopted transmission-based FTIRM, which reduces specimen preparation time and broadens the range of specimens that can be imaged. In this study, mature mouse femurs were plastic-embedded and longitudinal sections were cut at a thickness of 4 μm for transmission-based FTIRM measurements. The remaining bone blocks were polished for specular reflectance-based FTIRM measurements on regions immediately adjacent to the transmission sections. Kramers-Kronig analysis of the reflectance data yielded the dielectric response from which the absorption coefficients were directly determined. The reflectance-derived absorbance was validated empirically using the transmission spectra from the thin sections. The spectral assignments for mineralization, carbonate substitution, and collagen cross-linking were indistinguishable in transmission and reflection geometries, while the stoichiometric/nonstoichiometric apatite crystallinity parameter shifted from 1032/1021 cm(-1) in transmission-based to 1035/1025 cm(-1) in reflection-based data. This theoretical demonstration and empirical validation of reflection-based FTIRM eliminates the need for thin sections of bone and more readily facilitates direct correlations with other methods such as nanoindentation and quantitative backscatter electron imaging (qBSE) from the same specimen. It provides a unique framework for correlating bone's material and mechanical properties.
Figures
Figure 1
(Red) A typical FTIRM spectrum of bone showing the characteristic protein and mineral components. (Blue) A FTIRM spectrum taken from a bone section that is too thick, illustrating detector saturation at the ν1ν3 phosphate peak. (Black) The FTIR spectrum of the embedding medium, PMMA, showing peaks that overlap with the bone spectrum. Spectra were offset by 0.5 absorbance units for clarity.
Figure 2
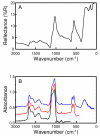
(A) A FTIRM spectrum of a mineralized bone block collected in a reflection geometry. (B) FTIRM absorbance spectra calculated from the reflectance data in (A) with a low-frequency cutoff at 650 (black), 400 (red) and 70 cm−1 (blue). Spectra were offset by 0.25 absorbance units for clarity.
Figure 3
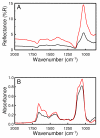
(A) FTIRM reflectance spectra of a polished (red) and unpolished (black) bone block. The polished bone block has a net reflectance nearly double that of the unpolished block over the entire range of the spectrum. (B) FTIRM absorbance spectra calculated from the reflectance data in (A). The polished bone block (red) has a higher absorbance than the unpolished block (black), consistent with the increased reflectance as seen in (A). However, the relative peak intensities are not affected by the quality of polishing.
Figure 4
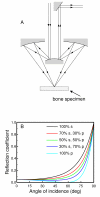
(A) Schematic overview of the reflection geometry configuration using a Schwarzschild objective typically employed in IR microscopes. The central obscuration limits the half angle to a range between 15 - 40°. (B) Plot of the reflection coefficient versus angle of incidence as a function of polarization for hydroxyapatite (n=1.530). The reflection coefficient changes as a function of angle of incidence, but remains sufficiently constant out to 40° such that is does not measurably affect analysis.
Figure 5
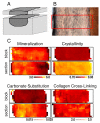
(A) Schematic of specimen preparation. Thin sections were cut from the top surface of the bone block and imaged in a transmission geometry. The bone block was then imaged before and after polishing. (B) Light micrograph of an embedded and polished bone specimen with the highlighted area showing the region that was scanned using reflection FTIRM. (C) Integration maps showing the distribution of mineralization, crystallinity, carbonate substitution and collagen cross-linking for matching bone blocks and thin sections.
Figure 6
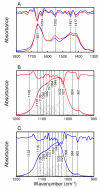
(A) Transmission (red) and reflection-derived (blue) absorbance spectra and second-derivative spectra showing identical peak positions of the amide I, amide II, and CO 2-3 bands. Curve-fitting of the ν1,ν3 PO43− domain from (B) transmission and (C) reflection spectra based on peak positions from second-derivative spectra. Individual Gaussian/Lorentzian distributions and the resultant spectrum are also shown (black). The stoichiometric and non-stoichiometric apatite peaks are shifted from 1032 and 1021 cm−1 in the transmission spectrum to 1035 and 1025 cm−1 in the reflection-derived absorbance spectrum.
Similar articles
- Alteration of the bone tissue material properties in type 1 diabetes mellitus: A Fourier transform infrared microspectroscopy study.
Mieczkowska A, Mansur SA, Irwin N, Flatt PR, Chappard D, Mabilleau G. Mieczkowska A, et al. Bone. 2015 Jul;76:31-9. doi: 10.1016/j.bone.2015.03.010. Epub 2015 Mar 23. Bone. 2015. PMID: 25813583 - Optimal methods for processing mineralized tissues for Fourier transform infrared microspectroscopy.
Aparicio S, Doty SB, Camacho NP, Paschalis EP, Spevak L, Mendelsohn R, Boskey AL. Aparicio S, et al. Calcif Tissue Int. 2002 May;70(5):422-9. doi: 10.1007/s00223-001-1016-z. Epub 2002 Mar 27. Calcif Tissue Int. 2002. PMID: 12055658 - Accretion of bone quantity and quality in the developing mouse skeleton.
Miller LM, Little W, Schirmer A, Sheik F, Busa B, Judex S. Miller LM, et al. J Bone Miner Res. 2007 Jul;22(7):1037-45. doi: 10.1359/jbmr.070402. J Bone Miner Res. 2007. PMID: 17402847 - From structure to cellular mechanism with infrared microspectroscopy.
Miller LM, Dumas P. Miller LM, et al. Curr Opin Struct Biol. 2010 Oct;20(5):649-56. doi: 10.1016/j.sbi.2010.07.007. Epub 2010 Aug 24. Curr Opin Struct Biol. 2010. PMID: 20739176 Free PMC article. Review. - Infrared assessment of bone quality: a review.
Paschalis EP, Mendelsohn R, Boskey AL. Paschalis EP, et al. Clin Orthop Relat Res. 2011 Aug;469(8):2170-8. doi: 10.1007/s11999-010-1751-4. Clin Orthop Relat Res. 2011. PMID: 21210314 Free PMC article. Review.
Cited by
- Correlative vibrational spectroscopy and 2D X-ray diffraction to probe the mineralization of bone in phosphate-deficient mice.
King HE, Tommasini SM, Rodriguez-Navarro AB, Mercado BQ, Skinner HCW. King HE, et al. J Appl Crystallogr. 2019 Aug 23;52(Pt 5):960-971. doi: 10.1107/S1600576719009361. eCollection 2019 Oct 1. J Appl Crystallogr. 2019. PMID: 31636517 Free PMC article. - Activation of nuclear factor-kappa B by TNF promotes nucleus pulposus mineralization through inhibition of ANKH and ENPP1.
Krzyzanowska AK, Frawley RJ, Damle S, Chen T, Otero M, Cunningham ME. Krzyzanowska AK, et al. Sci Rep. 2021 Apr 15;11(1):8271. doi: 10.1038/s41598-021-87665-2. Sci Rep. 2021. PMID: 33859255 Free PMC article. - Combination of Two Synchrotron Radiation-Based Techniques and Chemometrics to Study an Enhanced Natural Remineralization of Enamel.
Diez-García S, Sánchez-Martín MJ, Amigo JM, Valiente M. Diez-García S, et al. Anal Chem. 2022 Apr 5;94(13):5359-5366. doi: 10.1021/acs.analchem.1c05498. Epub 2022 Mar 23. Anal Chem. 2022. PMID: 35319204 Free PMC article. - An integrated study discloses chopping tools use from Late Acheulean Revadim (Israel).
Venditti F, Agam A, Tirillò J, Nunziante-Cesaro S, Barkai R. Venditti F, et al. PLoS One. 2021 Jan 19;16(1):e0245595. doi: 10.1371/journal.pone.0245595. eCollection 2021. PLoS One. 2021. PMID: 33465143 Free PMC article. - Function, life histories, and biographies of Lower Paleolithic patinated flint tools from Late Acheulian Revadim, Israel.
Efrati B, Barkai R, Cesaro SN, Venditti F. Efrati B, et al. Sci Rep. 2022 Mar 3;12(1):2885. doi: 10.1038/s41598-022-06823-2. Sci Rep. 2022. PMID: 35241694 Free PMC article.
References
- Judex S, Boyd S, Qin YX, Miller L, Muller R, Rubin C. Curr Osteoporos Rep. 2003;1:11–19. - PubMed
- Miller LM, Little W, Schirmer A, Sheik F, Busa B, Judex S. Journal of Bone and Mineral Research. 2007;22:1037–1045. - PubMed
- Isaksson H, Malkiewicz M, Nowak R, Helminen HJ, Jurvelin JS. Bone. 2010;47:1030–1038. - PubMed
Publication types
MeSH terms
Grants and funding
- S10 RR023782-01/RR/NCRR NIH HHS/United States
- R01 AR052778/AR/NIAMS NIH HHS/United States
- P30 EB009998/EB/NIBIB NIH HHS/United States
- AR052778/AR/NIAMS NIH HHS/United States
- S10 RR023782/RR/NCRR NIH HHS/United States
LinkOut - more resources
Full Text Sources

