Local generation of glia is a major astrocyte source in postnatal cortex - PubMed (original) (raw)
Local generation of glia is a major astrocyte source in postnatal cortex
Woo-Ping Ge et al. Nature. 2012.
Abstract
Glial cells constitute nearly 50% of the cells in the human brain. Astrocytes, which make up the largest glial population, are crucial to the regulation of synaptic connectivity during postnatal development. Because defects in astrocyte generation are associated with severe neurological disorders such as brain tumours, it is important to understand how astrocytes are produced. Astrocytes reportedly arise from two sources: radial glia in the ventricular zone and progenitors in the subventricular zone, with the contribution from each region shifting with time. During the first three weeks of postnatal development, the glial cell population, which contains predominantly astrocytes, expands 6-8-fold in the rodent brain. Little is known about the mechanisms underlying this expansion. Here we show that a major source of glia in the postnatal cortex in mice is the local proliferation of differentiated astrocytes. Unlike glial progenitors in the subventricular zone, differentiated astrocytes undergo symmetric division, and their progeny integrate functionally into the existing glial network as mature astrocytes that form endfeet with blood vessels, couple electrically to neighbouring astrocytes, and take up glutamate after neuronal activity.
Figures
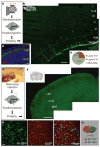
Figure 1. Locally generated glia as a major source of astrocytes
a, Procedure to label SVZ/radial glia-derived astrocytes by electroporation. b, The distribution of astrocytes (arrows) 2 weeks after electroporation. VZ, ventricular zone. c, Percentages of astrocytes at different locations. WM, white matter. d, Proliferating cells (Ki67+, red) in a cortical section of P3 mouse. Nuclei were stained with 4′,6-diamidino-2-phenylindole (DAPI, blue). e, Procedure to label locally proliferating cells by retrovirus. f, Cells labelled by retrovirus (green). g, Image of infected astrocytes. Astrocytes (BLBP+, red) with GFP (GFP+BLBP+) or without GFP (GFP−BLBP+) in the outlined region (dashed line) were included for analysis in h. RV, retrovirus. h, Percentages of astrocytes labelled by retrovirus injected locally, calculated as 100 ×(BLBP+GFP+ cells/BLBP+ cells). Scale bars, 200 μm (b), 50 μm (d), 500 μm (f) and 40 μm (g).
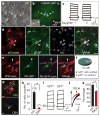
Figure 2. Properties of dividing cells within the cortex
a, Nuclei (arrowheads, Hoechst 33342) of dividing cells at different mitotic stages in acute brain slices. b, A dividing cell (differential interference contrast, arrow) at prometaphase (Hoechst 33342, arrowhead). c–e, Voltage responses from an Astro-like-D cell (c), a dividing NG2 glia (d) and a dividing SVZ cell (e). f–i, Current responses from a non-dividing (ND) astrocyte (f), an Astro-like-D cell (g), a dividing NG2 glia (h) and a dividing SVZ cell (i) evoked by step voltages (inset, g). j, Current–voltage curves in f–i (the circles indicate the positions of measurements). k, Astro-like-D cells (arrows; two at telophase, one at metaphase) stained with anti-GFAP (red). l, m, Morphology of a non-dividing astrocyte (arrow) and an Astro-like-D cell (arrowhead, l) in the cortex, and dividing cells (arrowheads) in the SVZ (m) of a P8 hGFAP-CreER;Ai14 transgenic mouse. n, Summary of the area covered by the processes of non-dividing astrocytes (grey), Astro-like-D cells (red) and SVZ dividing cells (blue) (10-μm _z_-projection with soma included, one-way analysis of variance followed by a Bonferroni post-hoc test; two asterisks, P < 0.01). o, A non-dividing astrocyte (arrow) was loaded with biocytin. A dividing astrocyte is labelled by biocytin (arrowhead). tg, transgenic. Scale bars, 5 μm (a) and 10 μm (b, k–m, o). Error bars indicate s.e.m.
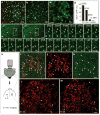
Figure 3. Time-lapse imaging of local proliferation of astrocytes
a–c, Proliferating astrocytes (arrowheads) in the cortex of hGFAP-GFP transgenic mice, at P3 (a), P6 (b) and P14 (c). d, Summarized data for the percentage of Ki67+GFP+ cells among GFP+ cells with strong GFP signals. e, f, Sequential images of a cortical slice from a P3 hGFAP-GFP transgenic mouse (e, parent cells (arrows); f, daughter cells (arrowheads)). g, Time-lapse images (1 h 52 min) of a dividing GFP+ cell in e and f. h, Procedure to image cell division in vivo. i–k, Images from a P4 triply transgenic hGFAP-CreER;Ai14;CAG-Fucci-Green mouse (i, combined images; j, tdTomato; k, mAG signal; arrowheads, dividing astrocytes). l, m, Time-lapse images at 1 h 35 min (l) and 18 h 58 min (m) from a P5 hGFAP-CreER;Ai14 transgenic mouse (arrowheads, dividing astrocytes). Scale bars, 40 μm (a–g) and 100 μm (k, m).
Figure 4. Symmetric division of proliferating astrocytes and the function of their progeny
a, A pair of daughter astrocytes (arrowheads) at late telophase under differential interference contrast. b, Both cells had GFP signal. Nuclei were stained with Hoechst 33342 (HO, inset). c, Voltage responses of two daughter cells evoked by step currents (−1 to 6 nA). d, Two daughter cells in telophase (arrowheads) from a P8 hGFAP-CreER;Ai14 transgenic mouse. e, An astrocyte infected by GFP-expressing retroviruses (green) and expressing tdTomato (red) formed endfeet (arrows) with blood vessels (Laminin+, purple) in a P19 hGFAP-CreER;Ai14 transgenic mouse. Tamoxifen was injected at P2, and cells were infected with retrovirus at P5. f, The percentage of progeny cells marked by retroviruses (GFP+tdTomato+) that had endfeet (GFP+tdTomato+ with endfeet, blue). g, A retrovirus-infected astrocyte progeny (GFP+, green, arrow) in the absence (Ctrl, upper) or presence (lower) of 100 μM carbenoxolene (CBX) was injected with biocytin (red). Without CBX, both GFP+ astrocytes (arrowheads) and GFP− astrocytes (asterisks) contained biocytin (red), as a result of gap-junction coupling with the astrocyte progeny injected with biocytin. h, The number of cells coupled. Two asterisks, P < 0.01, (unpaired _t_-test). i, Current responses of uninfected (GFP−) and infected (GFP+) astrocyte progeny. j, k, Glutamate transporter current (j) and its summarized data (k) from infected astrocyte progeny before (black) and after (red) application of blocker TBOA (100 μM, 70.4 ±5.3%, n =7). Two asterisks, P < 0.01 (paired _t_-test). Scale bars, 10 μm (a, b, d, e) and 20 μm (g). Error bars indicate s.e.m.
Comment in
- Sourcing local produce.
Welberg L. Welberg L. Nat Rev Neurosci. 2012 Apr 18;13(5):290. doi: 10.1038/nrn3247. Nat Rev Neurosci. 2012. PMID: 22510892 No abstract available.
Similar articles
- Developmental and post-injury cortical gliogenesis: a genetic fate-mapping study with Nestin-CreER mice.
Burns KA, Murphy B, Danzer SC, Kuan CY. Burns KA, et al. Glia. 2009 Aug 1;57(10):1115-29. doi: 10.1002/glia.20835. Glia. 2009. PMID: 19115384 Free PMC article. - Reinduction of ErbB2 in astrocytes promotes radial glial progenitor identity in adult cerebral cortex.
Ghashghaei HT, Weimer JM, Schmid RS, Yokota Y, McCarthy KD, Popko B, Anton ES. Ghashghaei HT, et al. Genes Dev. 2007 Dec 15;21(24):3258-71. doi: 10.1101/gad.1580407. Genes Dev. 2007. PMID: 18079173 Free PMC article. - Local production of astrocytes in the cerebral cortex.
Ge WP, Jia JM. Ge WP, et al. Neuroscience. 2016 May 26;323:3-9. doi: 10.1016/j.neuroscience.2015.08.057. Epub 2015 Sep 4. Neuroscience. 2016. PMID: 26343293 Free PMC article. Review. - Cortical radial glial cells in human fetuses: depth-correlated transformation into astrocytes.
deAzevedo LC, Fallet C, Moura-Neto V, Daumas-Duport C, Hedin-Pereira C, Lent R. deAzevedo LC, et al. J Neurobiol. 2003 Jun;55(3):288-98. doi: 10.1002/neu.10205. J Neurobiol. 2003. PMID: 12717699 - Radial glial cells as neuronal precursors: a new perspective on the correlation of morphology and lineage restriction in the developing cerebral cortex of mice.
Götz M, Hartfuss E, Malatesta P. Götz M, et al. Brain Res Bull. 2002 Apr;57(6):777-88. doi: 10.1016/s0361-9230(01)00777-8. Brain Res Bull. 2002. PMID: 12031274 Review.
Cited by
- Reprogramming astroglia into neurons with hallmarks of fast-spiking parvalbumin-positive interneurons by phospho-site-deficient Ascl1.
Marichal N, Péron S, Beltrán Arranz A, Galante C, Franco Scarante F, Wiffen R, Schuurmans C, Karow M, Gascón S, Berninger B. Marichal N, et al. Sci Adv. 2024 Oct 25;10(43):eadl5935. doi: 10.1126/sciadv.adl5935. Epub 2024 Oct 25. Sci Adv. 2024. PMID: 39454007 Free PMC article. - Astrocyte allocation during brain development is controlled by Tcf4-mediated fate restriction.
Zhang Y, Li D, Cai Y, Zou R, Zhang Y, Deng X, Wang Y, Tang T, Ma Y, Wu F, Xie Y. Zhang Y, et al. EMBO J. 2024 Nov;43(21):5114-5140. doi: 10.1038/s44318-024-00218-x. Epub 2024 Sep 19. EMBO J. 2024. PMID: 39300210 Free PMC article. - Progress of Astrocyte-Neuron Crosstalk in Central Nervous System Diseases.
Zhang Y, Wang Z, Xu F, Liu Z, Zhao Y, Yang LZ, Fang W. Zhang Y, et al. Neurochem Res. 2024 Dec;49(12):3187-3207. doi: 10.1007/s11064-024-04241-6. Epub 2024 Sep 18. Neurochem Res. 2024. PMID: 39292330 Review. - Microglia Colonization Associated with Angiogenesis and Neural Cell Development.
Harry GJ. Harry GJ. Adv Neurobiol. 2024;37:163-178. doi: 10.1007/978-3-031-55529-9_10. Adv Neurobiol. 2024. PMID: 39207692 Review. - Astrocyte Development in the Rodent.
Xie Y, Harwell CC, Garcia ADR. Xie Y, et al. Adv Neurobiol. 2024;39:51-67. doi: 10.1007/978-3-031-64839-7_3. Adv Neurobiol. 2024. PMID: 39190071 Review.
References
- Azevedo FA, et al. Equal numbers of neuronal and nonneuronal cells make the human brain an isometrically scaled-up primate brain. J Comp Neurol. 2009;513:532–541. - PubMed
- Schwartzbaum JA, Fisher JL, Aldape KD, Wrensch M. Epidemiology and molecular pathology of glioma. Nat Clin Pract Neurol. 2006;2:494–503. - PubMed
- Cameron RS, Rakic P. Glial cell lineage in the cerebral cortex: a review and synthesis. Glia. 1991;4:124–137. - PubMed
- Marshall CA, Suzuki SO, Goldman JE. Gliogenic and neurogenic progenitors of the subventricular zone: who are they, where did they come from, and where are they going? Glia. 2003;43:52–61. - PubMed
Publication types
MeSH terms
Substances
Grants and funding
- R01 MH090258/MH/NIMH NIH HHS/United States
- 4R37MH065334/MH/NIMH NIH HHS/United States
- K99 NS073735/NS/NINDS NIH HHS/United States
- R01 MH084234/MH/NIMH NIH HHS/United States
- 1K99NS073735/NS/NINDS NIH HHS/United States
- P01 AG010435/AG/NIA NIH HHS/United States
- R00 NS073735/NS/NINDS NIH HHS/United States
- R37 MH065334/MH/NIMH NIH HHS/United States
- HHMI/Howard Hughes Medical Institute/United States
- MH090258/MH/NIMH NIH HHS/United States
LinkOut - more resources
Full Text Sources
Other Literature Sources


