Systematic identification of genomic markers of drug sensitivity in cancer cells - PubMed (original) (raw)
. 2012 Mar 28;483(7391):570-5.
doi: 10.1038/nature11005.
Elena J Edelman, Sonja J Heidorn, Chris D Greenman, Anahita Dastur, King Wai Lau, Patricia Greninger, I Richard Thompson, Xi Luo, Jorge Soares, Qingsong Liu, Francesco Iorio, Didier Surdez, Li Chen, Randy J Milano, Graham R Bignell, Ah T Tam, Helen Davies, Jesse A Stevenson, Syd Barthorpe, Stephen R Lutz, Fiona Kogera, Karl Lawrence, Anne McLaren-Douglas, Xeni Mitropoulos, Tatiana Mironenko, Helen Thi, Laura Richardson, Wenjun Zhou, Frances Jewitt, Tinghu Zhang, Patrick O'Brien, Jessica L Boisvert, Stacey Price, Wooyoung Hur, Wanjuan Yang, Xianming Deng, Adam Butler, Hwan Geun Choi, Jae Won Chang, Jose Baselga, Ivan Stamenkovic, Jeffrey A Engelman, Sreenath V Sharma, Olivier Delattre, Julio Saez-Rodriguez, Nathanael S Gray, Jeffrey Settleman, P Andrew Futreal, Daniel A Haber, Michael R Stratton, Sridhar Ramaswamy, Ultan McDermott, Cyril H Benes
Affiliations
- PMID: 22460902
- PMCID: PMC3349233
- DOI: 10.1038/nature11005
Systematic identification of genomic markers of drug sensitivity in cancer cells
Mathew J Garnett et al. Nature. 2012.
Abstract
Clinical responses to anticancer therapies are often restricted to a subset of patients. In some cases, mutated cancer genes are potent biomarkers for responses to targeted agents. Here, to uncover new biomarkers of sensitivity and resistance to cancer therapeutics, we screened a panel of several hundred cancer cell lines--which represent much of the tissue-type and genetic diversity of human cancers--with 130 drugs under clinical and preclinical investigation. In aggregate, we found that mutated cancer genes were associated with cellular response to most currently available cancer drugs. Classic oncogene addiction paradigms were modified by additional tissue-specific or expression biomarkers, and some frequently mutated genes were associated with sensitivity to a broad range of therapeutic agents. Unexpected relationships were revealed, including the marked sensitivity of Ewing's sarcoma cells harbouring the EWS (also known as EWSR1)-FLI1 gene translocation to poly(ADP-ribose) polymerase (PARP) inhibitors. By linking drug activity to the functional complexity of cancer genomes, systematic pharmacogenomic profiling in cancer cell lines provides a powerful biomarker discovery platform to guide rational cancer therapeutic strategies.
Figures
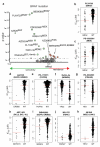
Figure 1. A systematic screen in cancer cell lines identifies therapeutic biomarkers
a, The number of tumour-derived cell lines used for screening classified according to tissue type (n = 639 in total). b, The panel of 130 screening drugs classified according to their therapeutic targets, primary effector pathways, and cellular functions. A single drug may be included in multiple categories. The inset indicates the number of drugs screened against a selection of prototype cancer targets. c, A volcano plot representation of MANOVA results showing the magnitude (effect; x-axis) and significance (p-value; inverted y-axis) of all drug-gene associations. Each circle represents a single drug-gene interaction and the size is proportional to the number of mutant cell lines screened (range 1 – 334). The horizontal dashed line indicates the threshold of statistical significance (0.2 FDR, P < 0.0099). Insets I and II are magnified views of selected highly significant associations and the drug name, therapeutically relevant target(s) (in superscript), and cancer gene (in brackets) are given for each. The p-values for nilotinibABL(BCR-ABL), P = 2.54 × 10−65, and nutlin-3aMDM2(TP53), _P_= 2.78 × 10−37, have been capped at 1 × 10⁻²⁸ in this representation.
Figure 2. Biomarkers of drug sensitivity and resistance
a, Gene-specific volcano plots of drug sensitivity associated with BRAF mutations in cancer cell lines (n = 54). b-k, Scatter plots of cell line IC50 (uM) values from selected drug-gene associations. IC50 values are on a log scale comparing mutated or non-mutated (WT) cell lines. Each circle represents the IC50 of one cell line and the red bar is the geometric mean. The drug name is indicated above each plot and therapeutic drug target(s) are bracketed.
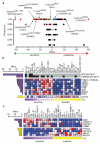
Figure 3. Multi-feature genomic signatures of drug response
a, The top drug-feature associations identified by the EN are plotted for their frequency and effect size. Associations are colored black for expression features, red for mutations, blue for copy number, and green for tissue. b-c. Heatmaps of highly significant EN features associated with response to b, dasatinib (inhibitor of SRC,ABL) and c, 17-AAG (HSP90 inhibitor) for the 14 most sensitive (purple) and resistant (yellow) cell lines. For each cell line mutation features are at the top of the heatmap shown in black (present) or gray (absent), followed by expression features (blue corresponds to lower expression, red to higher expression). To the left of each feature is a bar indicating the absolute value of the effect size. Bars in purple are negative effects, indicating features associated with sensitivity, and bars in yellow are positive effects, indicating features associated with resistance. The natural log IC50 values are represented at the bottom. For clarity, only the top 4 features associated with sensitivity and resistance to 17-AAG are shown.
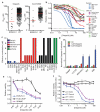
Figure 4. Ewing’s sarcoma cell lines are sensitive to PARP inhibition
a, The IC50 values of WT and EWS-FLI1 fusion positive cell lines to olaparib and AG-014699. b, Dose response curves to olaparib following 6-days constant drug exposure. Cell lines are classified according to tissue sub-type. c, Colony formation assays were performed for 7-21 days over a range of olaparib concentrations (0.1, 0.32, 1, 3.2 or 10 uM) and the concentration at which the number of colonies is reduced >90% for each cell line is indicated. d, Olaparib induced apoptosis in Ewing’s sarcoma cell lines following 72 hours treatment. e, Sensitivity to olaparib of EWS-FLI1 and FUS-CHOP transformed mouse mesenchymal cells compared to the SK-N-MC cell line (which harbors the EWS-FLI1 fusion). f, Sensitivity to olaparib of A673 cells transiently transfected with (siEF1) and without (siCT) EWS-FLI1 specific siRNA. All error bars are s.d from triplicate measurements except for b where error bars have been removed for clarity.
Comment in
- Drug discovery: Cell lines battle cancer.
Weinstein JN. Weinstein JN. Nature. 2012 Mar 28;483(7391):544-5. doi: 10.1038/483544a. Nature. 2012. PMID: 22460893 No abstract available. - Genetics: Cells line up to be characterized.
Kirk R. Kirk R. Nat Rev Clin Oncol. 2012 Apr 3;9(5):249. doi: 10.1038/nrclinonc.2012.56. Nat Rev Clin Oncol. 2012. PMID: 22473099 No abstract available. - Cancer genomics: Constructing a 'cancerpaedia'.
Gunter C. Gunter C. Nat Rev Genet. 2012 Apr 18;13(5):300. doi: 10.1038/nrg3221. Nat Rev Genet. 2012. PMID: 22510763 No abstract available. - Genomics: Constructing a 'cancerpaedia'.
Gunter C. Gunter C. Nat Rev Cancer. 2012 Apr 19;12(5):315. doi: 10.1038/nrc3275. Nat Rev Cancer. 2012. PMID: 22513402 No abstract available. - Cancer genomics: Constructing a 'cancerpaedia'.
Gunter C. Gunter C. Nat Rev Drug Discov. 2012 Apr 30;11(5):353. doi: 10.1038/nrd3730. Nat Rev Drug Discov. 2012. PMID: 22543463 No abstract available.
Similar articles
- Inhibition of the oncogenic fusion protein EWS-FLI1 causes G2-M cell cycle arrest and enhanced vincristine sensitivity in Ewing's sarcoma.
Zöllner SK, Selvanathan SP, Graham GT, Commins RMT, Hong SH, Moseley E, Parks S, Haladyna JN, Erkizan HV, Dirksen U, Hogarty MD, Üren A, Toretsky JA. Zöllner SK, et al. Sci Signal. 2017 Oct 3;10(499):eaam8429. doi: 10.1126/scisignal.aam8429. Sci Signal. 2017. PMID: 28974650 Free PMC article. - PARP-1 inhibition as a targeted strategy to treat Ewing's sarcoma.
Brenner JC, Feng FY, Han S, Patel S, Goyal SV, Bou-Maroun LM, Liu M, Lonigro R, Prensner JR, Tomlins SA, Chinnaiyan AM. Brenner JC, et al. Cancer Res. 2012 Apr 1;72(7):1608-13. doi: 10.1158/0008-5472.CAN-11-3648. Epub 2012 Jan 27. Cancer Res. 2012. PMID: 22287547 Free PMC article. - High ALDH activity identifies chemotherapy-resistant Ewing's sarcoma stem cells that retain sensitivity to EWS-FLI1 inhibition.
Awad O, Yustein JT, Shah P, Gul N, Katuri V, O'Neill A, Kong Y, Brown ML, Toretsky JA, Loeb DM. Awad O, et al. PLoS One. 2010 Nov 11;5(11):e13943. doi: 10.1371/journal.pone.0013943. PLoS One. 2010. PMID: 21085683 Free PMC article. - Promiscuous partnerships in Ewing's sarcoma.
Sankar S, Lessnick SL. Sankar S, et al. Cancer Genet. 2011 Jul;204(7):351-65. doi: 10.1016/j.cancergen.2011.07.008. Cancer Genet. 2011. PMID: 21872822 Free PMC article. Review. - EWS-FLI1 in Ewing's sarcoma: real targets and collateral damage.
Ban J, Siligan C, Kreppel M, Aryee D, Kovar H. Ban J, et al. Adv Exp Med Biol. 2006;587:41-52. doi: 10.1007/978-1-4020-5133-3_4. Adv Exp Med Biol. 2006. PMID: 17163154 Review.
Cited by
- Model ensembling as a tool to form interpretable multi-omic predictors of cancer pharmacosensitivity.
De Landtsheer S, Badkas A, Kulms D, Sauter T. De Landtsheer S, et al. Brief Bioinform. 2024 Sep 23;25(6):bbae567. doi: 10.1093/bib/bbae567. Brief Bioinform. 2024. PMID: 39494610 Free PMC article. - Integrating molecular, biochemical, and immunohistochemical features as predictors of hepatocellular carcinoma drug response using machine-learning algorithms.
Matboli M, Al-Amodi HS, Khaled A, Khaled R, Ali M, Kamel HFM, Hamid MSAE, ELsawi HA, Habib EK, Youssef I. Matboli M, et al. Front Mol Biosci. 2024 Oct 16;11:1430794. doi: 10.3389/fmolb.2024.1430794. eCollection 2024. Front Mol Biosci. 2024. PMID: 39479501 Free PMC article. - Developmental-status-aware transcriptional decomposition establishes a cell state panorama of human cancers.
Luo Y, Liang H. Luo Y, et al. Genome Med. 2024 Oct 28;16(1):124. doi: 10.1186/s13073-024-01393-6. Genome Med. 2024. PMID: 39468667 Free PMC article. - The present and future of the Cancer Dependency Map.
Arafeh R, Shibue T, Dempster JM, Hahn WC, Vazquez F. Arafeh R, et al. Nat Rev Cancer. 2024 Oct 28. doi: 10.1038/s41568-024-00763-x. Online ahead of print. Nat Rev Cancer. 2024. PMID: 39468210 Review. - IL-1 receptor-associated kinase 3 (IRAK3) in lung adenocarcinoma predicts prognosis and immunotherapy resistance: involvement of multiple inflammation-related pathways.
Zhou Y, Rao W, Li Z, Guo W, Shao F, Zhang Z, Zhang H, Liu T, Li Z, Tan F, Xue Q, Gao S, He J. Zhou Y, et al. Transl Lung Cancer Res. 2024 Sep 30;13(9):2139-2161. doi: 10.21037/tlcr-24-391. Epub 2024 Sep 12. Transl Lung Cancer Res. 2024. PMID: 39430338 Free PMC article.
References
- Druker BJ, et al. Five-year follow-up of patients receiving imatinib for chronic myeloid leukemia. N Engl J Med. 2006;355:2408–2417. - PubMed
- McDermott U, Settleman J. Personalized cancer therapy with selective kinase inhibitors: an emerging paradigm in medical oncology. J Clin Oncol. 2009;27:5650–5659. - PubMed
- Shoemaker RH, et al. Development of human tumor cell line panels for use in disease-oriented drug screening. Prog Clin Biol Res. 1988;276:265–286. - PubMed
METHODS REFERENCES
- Prieur A, Tirode F, Cohen P, Delattre O. EWS/FLI-1 silencing and gene profiling of Ewing cells reveal downstream oncogenic pathways and a crucial role for repression of insulin-like growth factor binding protein 3. Mol Cell Biol. 2004;24:7275–7283. doi:10.1128/MCB.24.16.7275-7283.2004. - PMC - PubMed
- Boland CR, et al. A National Cancer Institute Workshop on Microsatellite Instability for cancer detection and familial predisposition: development of international criteria for the determination of microsatellite instability in colorectal cancer. Cancer Res. 1998;58:5248–5257. - PubMed
- Bolstad BM, Irizarry RA, Astrand M, Speed TP. A comparison of normalization methods for high density oligonucleotide array data based on variance and bias. Bioinformatics. 2003;19:185–193. - PubMed
- Frey BJ, Dueck D. Clustering by passing messages between data points. Science. 2007;315:972–976. doi:10.1126/science.1136800. - PubMed
Publication types
MeSH terms
Substances
Grants and funding
- 086357/WT_/Wellcome Trust/United Kingdom
- U54 HG006097/HG/NHGRI NIH HHS/United States
- P41GM079575-02/GM/NIGMS NIH HHS/United States
- P41 GM079575/GM/NIGMS NIH HHS/United States
- WT_/Wellcome Trust/United Kingdom
- HHMI/Howard Hughes Medical Institute/United States
- 1U54HG006097-01/HG/NHGRI NIH HHS/United States
LinkOut - more resources
Full Text Sources
Other Literature Sources


