WNT signaling increases proliferation and impairs differentiation of stem cells in the developing cerebellum - PubMed (original) (raw)
. 2012 May;139(10):1724-33.
doi: 10.1242/dev.050104. Epub 2012 Mar 29.
Affiliations
- PMID: 22461560
- PMCID: PMC3328175
- DOI: 10.1242/dev.050104
WNT signaling increases proliferation and impairs differentiation of stem cells in the developing cerebellum
Yanxin Pei et al. Development. 2012 May.
Abstract
The WNT pathway plays multiple roles in neural development and is crucial for establishment of the embryonic cerebellum. In addition, WNT pathway mutations are associated with medulloblastoma, the most common malignant brain tumor in children. However, the cell types within the cerebellum that are responsive to WNT signaling remain unknown. Here we investigate the effects of canonical WNT signaling on two important classes of progenitors in the developing cerebellum: multipotent neural stem cells (NSCs) and granule neuron precursors (GNPs). We show that WNT pathway activation in vitro promotes proliferation of NSCs but not GNPs. Moreover, mice that express activated β-catenin in the cerebellar ventricular zone exhibit increased proliferation of NSCs in that region, whereas expression of the same protein in GNPs impairs proliferation. Although β-catenin-expressing NSCs proliferate they do not undergo prolonged expansion or neoplastic growth; rather, WNT signaling markedly interferes with their capacity for self-renewal and differentiation. At a molecular level, mutant NSCs exhibit increased expression of c-Myc, which might account for their transient proliferation, but also express high levels of bone morphogenetic proteins and the cyclin-dependent kinase inhibitor p21, which might contribute to their altered self-renewal and differentiation. These studies suggest that the WNT pathway is a potent regulator of cerebellar stem cell growth and differentiation.
Figures
Fig. 1.
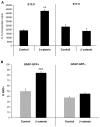
β-catenin increases the proliferation of a subpopulation of cells of the developing cerebellum. (A) Cells from the cerebellum of E13.5 or E17.5 wild-type (WT) mice were infected with control (GFP only) or β-catenin-IRES-GFP retroviruses for 48 hours, pulsed with tritiated thymidine (3H-Td) and cultured overnight before being assayed for 3H-Td incorporation. Data represent the mean (±s.e.m.) of triplicate samples. (B) GFP+ or GFP– cells were FACS sorted from cerebella of E14.5 hGFAP-GFP transgenic mice and infected with control (YFP only) or β-catenin-IRES-YFP retroviruses for 48 hours. There was no significant difference in infection rates of GFAP+ and GFAP– cells (45% and 40%, respectively). Cells were stained with Ki67 antibodies and the percentage of Ki67+ cells was counted. Data represent the mean (±s.e.m.) percentage of Ki67+ cells in six fields **, P<0.01; ***, P<0.0001; Student’s _t_-test.
Fig. 2.
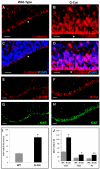
Activated β-catenin promotes proliferation in the cerebellar ventricular zone. (A,B) β-catenin immunostaining (red) of E14.5 cerebellum reveals increased expression in the ventricular zone (VZ, arrowheads) of hGFAP-Cre; Catnblox(Ex3) (G-Cat) mice (B) compared with WT mice (A). (C,D) Colocalization with DAPI (blue) highlights the cytoplasmic localization of β-catenin in WT mice (C) and nuclear localization in G-Cat mice (D). Arrowheads indicate the VZ. (E-H) Staining with anti-BrdU (red, E,F) or anti-Ki67 (green, G,H) shows increased proliferation in the VZ of E14.5 G-Cat mice (F,H) compared with WT mice (E,G). (I,J) Number of Ki67+ cells per section in the VZ of WT and G-Cat mice at E14.5 (I) and at E13.5, E16.5 and P0 (J). Data represent the mean (±s.e.m.) number of Ki67+ cells per section of six sections. *, P<0.01; **, P<0.001. Scale bars: 50 μm.
Fig. 3.
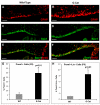
Activated β-catenin increases the number of stem cells in the embryonic and neonatal cerebellum. (A-F) Cerebellar sections from E14.5 WT (A,C,E) or G-Cat (B,D,F) mice were stained with anti-GFAP antibodies (red in A,B) or anti-Sox1 (green) and anti-BrdU (red) antibodies (C-F). Note the increased expression of GFAP and Sox1 and the colocalization of Sox1 and BrdU in the mutant VZ. (G,H) Increased numbers of progenitors (G) and stem cells (H) in the cerebellum white matter in G-Cat mice compared with WT mice at P0. Cells isolated from the cerebellum of P0 WT and G-Cat mice were stained with antibodies specific for prominin 1 (Prom1) and for lineage (Lin) markers (PSA-NCAM, O4 and TAPA-1). The percentage of Prom1+ progenitors (G) and Prom1+ Lin– stem cells (H) was analyzed by flow cytometry. Data represent mean (± s.e.m.) percentages from three separate experiments. *, P<0.01. Scale bars: 50 μm.
Fig. 4.
Activation of β-catenin in stem cells impairs neuronal and glial differentiation. (A-L) Sections from P0 WT (A,C,E,G,I,K) and G-Cat (B,D,F,H,J,L) cerebella were stained with antibodies specific for Ki67 (A,B) to label proliferating cells, Pax6 (C,D) to label granule neuron precursors (GNPs), calbindin (E,F) to mark Purkinje neurons, Pax2 (G,H) to detect stellate and basket interneuron precursors, and S100β (I,J) or BLBP (K,L) to detect glial cells. All sections were counterstained with DAPI. Note the marked reduction in progenitors and differentiated cells in G-Cat mice. Scale bar: 50 μm.
Fig. 5.
Deletion of Apc in stem cells also impairs differentiation. (A-J) Sections from P0 WT (A,C,E,G,I) and hGFAP-Cre; Apclox/lox (G-APC; B,D,F,H,J) cerebella were stained with antibodies specific for Ki67 (A,B) to label proliferating cells, Pax6 (C,D) to label GNPs, calbindin (E,F) to mark Purkinje neurons, Pax2 (G,H) to detect stellate and basket interneuron precursors, and S100β (I,J) to detect glial cells. Sections were counterstained with DAPI. Note the marked reduction in progenitors and differentiated cells in G-APC mice. Scale bar: 50 μm.
Fig. 6.
β-catenin-expressing stem cells exhibit aberrant self-renewal and differentiation in vitro. (A,B) Prom1+ Lin– cells were sorted from P0 WT (A) or G-Cat (B) mouse cerebellum and cultured at clonal density in serum-free medium containing 25 ng/ml EGF and bFGF for 7 days before being photographed under bright-field. Passageable neurospheres were consistently obtained from WT but not from mutant cerebellum. (C) Average neurosphere numbers (±s.e.m.) per field from eight fields in P0 WT or G-Cat cerebellum. (D,E) Prom1+ Lin– cells were sorted from P0 WT (D) or G-Cat (E) cerebellum and cultured for 3 days in medium containing 1% FBS. Cells were stained with antibodies specific for the neuronal marker Map2 (red) and the glial cell marker S100β (green). (F) Quantitation (mean ± s.e.m.) of Map2/S100β staining from five fields. *, P<0.01; **, P<0.001. Whereas WT stem cells differentiated predominantly into neurons, G-Cat showed a marked skewing toward glial lineages. Scale bars: 25 μm in A,B; 50 μm in D,E.
Fig. 7.
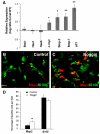
Stem cells from G-Cat mice express elevated levels of BMPs and p21. (A) Quantitative RT-PCR was performed on Prom1+ Lin– cells isolated from P0 WT and G-Cat mice using primers for the indicated genes. Mice from four litters were analyzed, and after normalization to actin the expression of each gene in G-Cat cells was compared with that in WT littermates to calculate a ratio of gene expression for each litter. Data are plotted as the mean (±s.e.m.) log ratio (G-Cat:WT). *, P<0.02; **, P<0.05. (B-D) Noggin promotes neuronal differentiation. Prom1+ Lin– cells were isolated from P0 G-Cat mice, treated with noggin protein (200 ng/ml) and cultured for 3 days in serum-containing media to promote differentiation. Cells were stained for Map2 (red) and S100β (green). Quantitation (mean ± s.e.m.) of Map2/S100β staining is from six fields. *, P<0.01. Scale bar: 50 μm.
References
- Bonaguidi M. A., McGuire T., Hu M., Kan L., Samanta J., Kessler J. A. (2005). LIF and BMP signaling generate separate and discrete types of GFAP-expressing cells. Development 132, 5503–5514 - PubMed
- Brault V., Moore R., Kutsch S., Ishibashi M., Rowitch D. H., McMahon A. P., Sommer L., Boussadia O., Kemler R. (2001). Inactivation of the β-catenin gene by Wnt1-Cre-mediated deletion results in dramatic brain malformation and failure of craniofacial development. Development 128, 1253–1264 - PubMed
- Chenn A., Walsh C. A. (2002). Regulation of cerebral cortical size by control of cell cycle exit in neural precursors. Science 297, 365–369 - PubMed
- Chenn A., Walsh C. A. (2003). Increased neuronal production, enlarged forebrains and cytoarchitectural distortions in beta-catenin overexpressing transgenic mice. Cereb. Cortex 13, 599–606 - PubMed
- Cho Y. J., Tsherniak A., Tamayo P., Santagata S., Ligon A., Greulich H., Berhoukim R., Amani V., Goumnerova L., Eberhart C. G., et al. (2010). Integrative genomic analysis of medulloblastoma identifies a molecular subgroup that drives poor clinical outcome. J. Clin. Oncol. 29, 1424–1430 - PMC - PubMed
Publication types
MeSH terms
Substances
LinkOut - more resources
Full Text Sources
Molecular Biology Databases


