Correlative 3D superresolution fluorescence and electron microscopy reveal the relationship of mitochondrial nucleoids to membranes - PubMed (original) (raw)
Correlative 3D superresolution fluorescence and electron microscopy reveal the relationship of mitochondrial nucleoids to membranes
Benjamin G Kopek et al. Proc Natl Acad Sci U S A. 2012.
Abstract
Microscopic images of specific proteins in their cellular context yield important insights into biological processes and cellular architecture. The advent of superresolution optical microscopy techniques provides the possibility to augment EM with nanometer-resolution fluorescence microscopy to access the precise location of proteins in the context of cellular ultrastructure. Unfortunately, efforts to combine superresolution fluorescence and EM have been stymied by the divergent and incompatible sample preparation protocols of the two methods. Here, we describe a protocol that preserves both the delicate photoactivatable fluorescent protein labels essential for superresolution microscopy and the fine ultrastructural context of EM. This preparation enables direct 3D imaging in 500- to 750-nm sections with interferometric photoactivatable localization microscopy followed by scanning EM images generated by focused ion beam ablation. We use this process to "colorize" detailed EM images of the mitochondrion with the position of labeled proteins. The approach presented here has provided a new level of definition of the in vivo nature of organization of mitochondrial nucleoids, and we expect this straightforward method to be applicable to many other biological questions that can be answered by direct imaging.
Conflict of interest statement
The authors declare no conflict of interest.
Figures
Fig. 1.
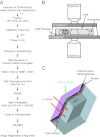
Overview of correlative iPALM and EM procedure and the imaging systems. (A) Flow diagram showing the steps involved in correlating iPALM and EM images. (B) iPALM imaging setup shows the 500- to 750-nm-thick cryosection sandwiched between the two opposing objectives and coverslips. The cryosection sits on gold fiducials and remains hydrated with PBS solution. (C) Schematic shows how the ion beam mills through the sample and into the coverglass (double arrows). The coverglass has a few gold fiducials (yellow dots), and is covered with the section (gray image), coated with methylcellulose and cyanoacrylate (black), and covered with a thin layer of carbon for charge conductivity (purple).
Fig. 2.
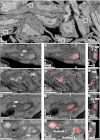
Correlated images of TFAM-mEos2 iPALM data with EM images generated by FIB-SEM. Labels denote cellular nuclei (Nu), the mitochondrial boundary membrane (BM), including the outer and inner mitochondrial membranes, and cristae (Cr). (A) A correlated iPALM image of TFAM-mEos2 with a slice (x_–_y cross-section) from a FIB-SEM–generated volume showing many different cells containing nucleoids. Lettered boxes correspond to the magnified images shown in C, F, I, and L, except that I is rotated 90° with respective to its orientation in A. B, E, H, and K are slices through the FIB-SEM volume showing mitochondria with well defined membrane ultrastructure. C, F, I, and L show the aligned and overlaid TFAM-mEos2 iPALM data with the SEM images from B, E, H, and K. D, G, J, and M are slices (z_–_y or z_–_x cross-sections) through the iPALM/SEM correlated data that are perpendicular to C, F, I, and L, demonstrating the _z_-dimension of the data. White hatch marks in C, F, I, and L indicate the location through the image from which the perpendicular plane shown in D, G, J, and M was derived. (Scale bars: 500 nm.)
Fig. 3.
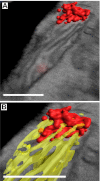
Three-dimensional map of a nucleoid and cristae membranes. Red indicates nucleoid, yellow indicates cristae. (A) Merged image of a 3D map of a nucleoid and a correlated SEM slice. (B) Closer view of the nucleoid in A with a cristae 3D map showing interaction of the cristae tips with the nucleoid. (Scale bars: 400 nm.)
Fig. 4.
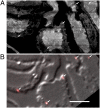
Alignment of the iPALM and EM data by using gold fiducials. Gold particles can be seen in both EM and fluorescence images. (A) An SEM image of a portion of an imaged area at a z height cutting through the fiducial decorated surface where the fiducials are seen as tiny white dots (arrows). (B) A differential interference contrast image of the cryosection overlaid with fluorescence images of fiducials (arrows). Alignment to less than 30 nm accuracy is made by finding the fiducial centroids in each image and applying a transformation to match the fiducial coordinates. (Scale bar: 5 μm.)
Similar articles
- Cross-strand binding of TFAM to a single mtDNA molecule forms the mitochondrial nucleoid.
Kukat C, Davies KM, Wurm CA, Spåhr H, Bonekamp NA, Kühl I, Joos F, Polosa PL, Park CB, Posse V, Falkenberg M, Jakobs S, Kühlbrandt W, Larsson NG. Kukat C, et al. Proc Natl Acad Sci U S A. 2015 Sep 8;112(36):11288-93. doi: 10.1073/pnas.1512131112. Epub 2015 Aug 24. Proc Natl Acad Sci U S A. 2015. PMID: 26305956 Free PMC article. - Superresolution fluorescence imaging of mitochondrial nucleoids reveals their spatial range, limits, and membrane interaction.
Brown TA, Tkachuk AN, Shtengel G, Kopek BG, Bogenhagen DF, Hess HF, Clayton DA. Brown TA, et al. Mol Cell Biol. 2011 Dec;31(24):4994-5010. doi: 10.1128/MCB.05694-11. Epub 2011 Oct 17. Mol Cell Biol. 2011. PMID: 22006021 Free PMC article. - Imaging cellular ultrastructure by PALM, iPALM, and correlative iPALM-EM.
Shtengel G, Wang Y, Zhang Z, Goh WI, Hess HF, Kanchanawong P. Shtengel G, et al. Methods Cell Biol. 2014;123:273-94. doi: 10.1016/B978-0-12-420138-5.00015-X. Methods Cell Biol. 2014. PMID: 24974033 - Visualizing cell structure and function with point-localization superresolution imaging.
Sengupta P, Van Engelenburg S, Lippincott-Schwartz J. Sengupta P, et al. Dev Cell. 2012 Dec 11;23(6):1092-102. doi: 10.1016/j.devcel.2012.09.022. Dev Cell. 2012. PMID: 23237943 Free PMC article. Review. - Approaches toward super-resolution fluorescence imaging of mitochondrial proteins using PALM.
Brown TA, Fetter RD, Tkachuk AN, Clayton DA. Brown TA, et al. Methods. 2010 Aug;51(4):458-63. doi: 10.1016/j.ymeth.2010.01.001. Epub 2010 Jan 12. Methods. 2010. PMID: 20060907 Free PMC article. Review.
Cited by
- Visualization of cristae and mtDNA interactions via STED nanoscopy using a low saturation power probe.
Ren W, Ge X, Li M, Sun J, Li S, Gao S, Shan C, Gao B, Xi P. Ren W, et al. Light Sci Appl. 2024 May 24;13(1):116. doi: 10.1038/s41377-024-01463-9. Light Sci Appl. 2024. PMID: 38782912 Free PMC article. - In-section Click-iT detection and super-resolution CLEM analysis of nucleolar ultrastructure and replication in plants.
Franek M, Koptašíková L, Mikšátko J, Liebl D, Macíčková E, Pospíšil J, Esner M, Dvořáčková M, Fajkus J. Franek M, et al. Nat Commun. 2024 Mar 19;15(1):2445. doi: 10.1038/s41467-024-46324-6. Nat Commun. 2024. PMID: 38503728 Free PMC article. - TOP3A coupling with replication forks and repair of TOP3A cleavage complexes.
Saha LK, Pommier Y. Saha LK, et al. Cell Cycle. 2024 Jan;23(2):115-130. doi: 10.1080/15384101.2024.2314440. Epub 2024 Feb 11. Cell Cycle. 2024. PMID: 38341866 Review. - Targeting DNA2 overcomes metabolic reprogramming in multiple myeloma.
Thongon N, Ma F, Baran N, Lockyer P, Liu J, Jackson C, Rose A, Furudate K, Wildeman B, Marchesini M, Marchica V, Storti P, Todaro G, Ganan-Gomez I, Adema V, Rodriguez-Sevilla JJ, Qing Y, Ha MJ, Fonseca R, Stein C, Class C, Tan L, Attanasio S, Garcia-Manero G, Giuliani N, Berrios Nolasco D, Santoni A, Cerchione C, Bueso-Ramos C, Konopleva M, Lorenzi P, Takahashi K, Manasanch E, Sammarelli G, Kanagal-Shamanna R, Viale A, Chesi M, Colla S. Thongon N, et al. Nat Commun. 2024 Feb 8;15(1):1203. doi: 10.1038/s41467-024-45350-8. Nat Commun. 2024. PMID: 38331987 Free PMC article. - SIRT1 inhibits mitochondrial hyperfusion associated mito-bulb formation to sensitize oral cancer cells for apoptosis in a mtROS-dependent signalling pathway.
Patra S, Singh A, Praharaj PP, Mohanta NK, Jena M, Patro BS, Abusharha A, Patil S, Bhutia SK. Patra S, et al. Cell Death Dis. 2023 Nov 10;14(11):732. doi: 10.1038/s41419-023-06232-x. Cell Death Dis. 2023. PMID: 37949849 Free PMC article.
References
- Giepmans BN, Adams SR, Ellisman MH, Tsien RY. The fluorescent toolbox for assessing protein location and function. Science. 2006;312:217–224. - PubMed
- Klar TA, Hell SW. Subdiffraction resolution in far-field fluorescence microscopy. Opt Lett. 1999;24:954–956. - PubMed
- Betzig E, et al. Imaging intracellular fluorescent proteins at nanometer resolution. Science. 2006;313:1642–1645. - PubMed
Publication types
MeSH terms
Substances
LinkOut - more resources
Full Text Sources
Other Literature Sources
Molecular Biology Databases


