Microstratigraphic evidence of in situ fire in the Acheulean strata of Wonderwerk Cave, Northern Cape province, South Africa - PubMed (original) (raw)
Microstratigraphic evidence of in situ fire in the Acheulean strata of Wonderwerk Cave, Northern Cape province, South Africa
Francesco Berna et al. Proc Natl Acad Sci U S A. 2012.
Abstract
The ability to control fire was a crucial turning point in human evolution, but the question when hominins first developed this ability still remains. Here we show that micromorphological and Fourier transform infrared microspectroscopy (mFTIR) analyses of intact sediments at the site of Wonderwerk Cave, Northern Cape province, South Africa, provide unambiguous evidence--in the form of burned bone and ashed plant remains--that burning took place in the cave during the early Acheulean occupation, approximately 1.0 Ma. To the best of our knowledge, this is the earliest secure evidence for burning in an archaeological context.
Conflict of interest statement
The authors declare no conflict of interest.
Figures
Fig. 1.
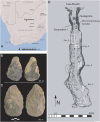
(A) Map showing the location of Wonderwerk Cave. (B_–_C) Handaxes characteristic of the Acheulean of stratum 10, excavation 1, Wonderwerk Cave. (D) Plan of Wonderwerk Cave generated by laser scanning shows the location of excavation areas discussed in this study (courtesy of H. Rüther, Zamani project).
Fig. 2.
(A) Photograph of the east section in excavation 1 with boundaries between archaeological strata 12 and 9. Numbered boxes indicate location of intact block sampled for microstratigraphic analysis. (Scale bar: 10 cm) (B) Representative micrograph of low-energy, water-bedded silt, sand, and 0.5-cm-thick gravel (lag) from stratum 12. (Scale bar: 1 mm.) (C) Micrograph of microfacies from white layer close to top of stratum 12 composed of diagenetically altered dolostone and flowstone, with nodules of montgomeryite (arrows). (D) Micrograph of reddish-brown, wind-blown silty clay aggregates that comprise several lithological units starting from the top of stratum 12. (Scale bar: 1 mm.) (E) Representative micrograph of wind-blown, fine sand mixed with millimeter-sized bone fragments from tan lithological units in strata 11, 10, and 9. (Scale bar: 1 mm.)
Fig. 3.
(A) Photograph of east profile corresponding to squares R/Q28 showing a detailed view of stratum 10. Box indicates approximate location of thin section (B), exhibiting three microstratigraphic units (microfacies): (1) bottom sandy silt and clay mixed with ashed plant material, dispersed wood ash, and bone fragments; (2) clay aggregates and fragments; and (3) rounded aggregates of sandy silt. Large red rectangular box indicates the location of boundary between microfacies 1 and 2, which is enlarged immediately above in C. Small blue box indicates subsurface location with wood ash pieces dispersed in silty sediment (enlarged in H). (C) Magnification of contact area between microfacies 1 and 2 in thin section shown in B shows characteristic of erosion and successive stabilized surface, on top of which are ashed plant material and bone fragments shown in micrographs (D_–_J). Boxes mark the location of microphotographs shown in D_–_G, I, and J (PPL). (Scale bar: 1 cm.). (D) Micrograph of fragments of ashed plant material (PPL). (Scale bars: 1 mm.) (E) Micrographs of lump of calcitic wood ash with typical ash rhombs (oxalate pseudomorphs) and prisms at the contact between microfacies 1 and 2 (PPL). (Scale bar: 500 μm.). (F and G) Micrographs of fragments of ashed plant material (PPL) (Scale bars: 1 mm.) (H) Sediment from microfacies 1, with fragmented ashed plant material and dispersed wood ash rhombs and prisms (oxalate pseudomorphs; PPL). (Scale bar: 1 mm.) (I) Micrograph of contact area between microfacies showing clay aggregates in microfacies 2 and organometallic area (degraded charred material?) and bone fragments resting on the surface of microfacies 1. (Scale bar: 1 mm.). (J) Micrograph of bone fragment. (Scale bar: 100 μm.)
Fig. 4.
Representative mFTIR reflectance spectra (red line) of bone fragments shown in micrographs of Fig. 4 and
Fig. S1
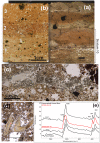
, and of an unheated and experimentally heated bone processed in the thin section (black lines). Appearance of infrared bands at 1,096 cm−1 and 630 cm−1 are used as heating temperature indicators, showing that the archaeological fragment was heated to more than 400 °C but less than 550 °C.
Fig. 5.
Selection of bone fragments recovered close to wood ash identified in thin section (excavation 1, stratum 10, square R28, elevation from top of stratum 10 of 15–20 cm) and their representative FTIR spectra. Gray and black bones (samples A, C, and D) show the presence of IR absorptions at 630 cm−1 and 1,090 cm−1 characteristic of bone mineral heated to more than 400 °C (32). Yellow (B) and white bone (E) fragments show IR spectral pattern characteristic of unheated bone or heated below 400 °C. The circular and irregular opaque nodules are composed of Fe and Mn oxides and a result of diagenetic impregnation.
Fig. P1.
(A) Photograph of profile in square Q28. Box indicates approximate location of thin section shown in B, exhibiting three microfacies: 1, bottom sand silt and clay mixed with ashed plant material, dispersed wood ash, and bone fragments; 2, clay aggregates and fragments; and 3, rounded aggregates of sandy silt. Boxes mark the location of the microphotographs shown in C and D. (C) Clump of calcitic wood ash with typical ash rhombs and prisms at the contact between microfacies 1 and 2. (D) Bone fragment from microfacies 1 in B. (E) Fourier transform IR reflectance spectra of bone fragment shown in micrograph (D, red line) and of unheated and experimentally heated bone processed in thin section (black lines). Appearance of infrared bands at 1,096 cm−1 and 630 cm−1 are used as heating temperature indicators, showing that the fragment was most probably heated to more than 400 °C.
Similar articles
- Radiometric dating of the Earlier Stone Age sequence in excavation I at Wonderwerk Cave, South Africa: preliminary results.
Chazan M, Ron H, Matmon A, Porat N, Goldberg P, Yates R, Avery M, Sumner A, Horwitz LK. Chazan M, et al. J Hum Evol. 2008 Jul;55(1):1-11. doi: 10.1016/j.jhevol.2008.01.004. Epub 2008 May 27. J Hum Evol. 2008. PMID: 18501953 - The Oldowan horizon in Wonderwerk Cave (South Africa): archaeological, geological, paleontological and paleoclimatic evidence.
Chazan M, Avery DM, Bamford MK, Berna F, Brink J, Fernandez-Jalvo Y, Goldberg P, Holt S, Matmon A, Porat N, Ron H, Rossouw L, Scott L, Horwitz LK. Chazan M, et al. J Hum Evol. 2012 Dec;63(6):859-66. doi: 10.1016/j.jhevol.2012.08.008. Epub 2012 Nov 3. J Hum Evol. 2012. PMID: 23127763 No abstract available. - Fire in the Plio-Pleistocene: the functions of hominin fire use, and the mechanistic, developmental and evolutionary consequences.
Attwell L, Kovarovic K, Kendal J. Attwell L, et al. J Anthropol Sci. 2015 Jul 20;93:1-20. doi: 10.4436/JASS.93006. Epub 2015 Mar 19. J Anthropol Sci. 2015. PMID: 25794155 - The origins of the Acheulean: past and present perspectives on a major transition in human evolution.
de la Torre I. de la Torre I. Philos Trans R Soc Lond B Biol Sci. 2016 Jul 5;371(1698):20150245. doi: 10.1098/rstb.2015.0245. Philos Trans R Soc Lond B Biol Sci. 2016. PMID: 27298475 Free PMC article. Review. - Variability in an early hominin percussive tradition: the Acheulean versus cultural variation in modern chimpanzee artefacts.
Gowlett JA. Gowlett JA. Philos Trans R Soc Lond B Biol Sci. 2015 Nov 19;370(1682):20140358. doi: 10.1098/rstb.2014.0358. Philos Trans R Soc Lond B Biol Sci. 2015. PMID: 26483536 Free PMC article. Review.
Cited by
- Stories in Action.
Walsh J, Vaida N, Coman A, Fiske ST. Walsh J, et al. Psychol Sci Public Interest. 2022 Dec;23(3):99-141. doi: 10.1177/15291006231161337. Psychol Sci Public Interest. 2022. PMID: 37161872 Free PMC article. - The curiously long absence of cooking in evolutionary thought.
Wrangham R. Wrangham R. Learn Behav. 2016 Jun;44(2):116-7. doi: 10.3758/s13420-016-0223-4. Learn Behav. 2016. PMID: 27059233 - Home Is Where the Hearth Is: Anthracological and Microstratigraphic Analyses of Pleistocene and Holocene Combustion Features, Riwi Cave (Kimberley, Western Australia).
Whitau R, Vannieuwenhuyse D, Dotte-Sarout E, Balme J, O'Connor S. Whitau R, et al. J Archaeol Method Theory. 2018;25(3):739-776. doi: 10.1007/s10816-017-9354-y. Epub 2017 Oct 26. J Archaeol Method Theory. 2018. PMID: 30100699 Free PMC article. - The use of fire and human distribution.
MacDonald K. MacDonald K. Temperature (Austin). 2017 Jan 24;4(2):153-165. doi: 10.1080/23328940.2017.1284637. eCollection 2017. Temperature (Austin). 2017. PMID: 28680931 Free PMC article. Review.
References
- Wrangham R. Catching Fire: How Cooking Made Us Human. New York: Basic Books; 2009.
- Karkanas P, et al. Evidence for habitual use of fire at the end of the Lower Paleolithic: site-formation processes at Qesem Cave, Israel. J Hum Evol. 2007;53:197–212. - PubMed
- Alperson-Afil N, Goren-Inbar N. The Acheulian Site of Gesher Benot Ya'aqov: Ancient Flames and Controlled Use of Fire. Vol 2. New York: Springer; 2010.
Publication types
MeSH terms
LinkOut - more resources
Full Text Sources


