Distinct and separable activities of the endocytic clathrin-coat components Fcho1/2 and AP-2 in developmental patterning - PubMed (original) (raw)
Distinct and separable activities of the endocytic clathrin-coat components Fcho1/2 and AP-2 in developmental patterning
P K Umasankar et al. Nat Cell Biol. 2012.
Abstract
Clathrin-mediated endocytosis occurs at multiple independent import sites on the plasma membrane, but how these positions are selected and how different cargo is simultaneously recognized is obscure. FCHO1 and FCHO2 are early-arriving proteins at surface clathrin assemblies and are speculated to act as compulsory coat nucleators, preceding the core clathrin adaptor AP-2. Here, we show that the μ-homology domain of FCHO1/2 represents an endocytic interaction hub. Translational silencing of fcho1 in zebrafish embryos causes strong dorsoventral patterning defects analogous to Bmp signal failure. The Fcho1 μ-homology domain interacts with the Bmp receptor Alk8, uncovering an endocytic component that positively modulates Bmp signal transmission. Still, the fcho1 morphant phenotype is distinct from severe embryonic defects apparent when AP-2 is depleted. Our data thus challenge the primacy of FCHO1/2 in coat initiation.
Figures
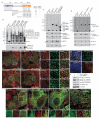
Figure 1
Binding properties of FCHO1 (a) Cartoon of FCHO1 with the location and relative binding properties of the various truncations tested. (b) Coomassie-stained gel and blot of supernatant (S) and pellet (P) fractions of a GST pull-down assay with brain cytosol and immobilized GST or the indicated GST-FCHO1 or GST-ARH fragments. Immunoblotted with anti-clathrin heavy chain (HC) and AP-1/2 β1/2-subunit antibodies. Molecular mass standards (kDa) are shown, and large adaptor subunits (arrowheads) indicated. (c) Pull-down assay with FCHO1 overexpressing HeLa cell lysate and immobilized GST or the indicated GST-fusion proteins. Two independent anti-FCHO1 antibodies used for detection. Non-specific bands (asterisks) are indicated. (d) Pull-down assay with FCHO1 overexpressing HeLa lysates and immobilized GST, GST-αC appendage or the indicated αC appendage point mutants. (e-l) Mock or AP-2 α-subunit siRNA-treated HeLa cells transfected with either GFP-FCHO1 or GFP-FCHO2 as indicated were incubated with Alexa568 transferrin on ice before fixation. Representative confocal images show AP-2 silencing leads to loss of transferrin clusters on the surface. Insets (f,h,i,l) provide color-separated and merged enlargements of boxed regions. Scale bar: 10 μm. (m) Confocal image of a region of an AP-2 α-subunit siRNA transfected HeLa cell also expressing GFP-FCHO1. Prior to fixation and staining with an anti-clathrin HC mAb, the silenced cells were incubated at 37°C with 25 μg/ml Alexa633-labeled transferrin. (n) Biochemical assessment of AP-2 siRNA silencing in HeLa cell lysates by immunoblotting. (o-r) Representative confocal images of the intracellular localization of full-length (1-889), EFC domain (1-275), ΔμHD (1-609) or μHD (609-889) GFP-tagged FCHO1 compared with AP-2 (α subunit). Insets provide color-separated and merged enlargements of boxed regions. Scale bar: 10 μm.
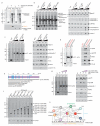
Figure 2
The μHD interaction hub (a) Coomassie-stained gel and blot of supernatant (S) and pellet (P) fractions of a pull-down assay with full-length or ΔμHD (1-609) FCHO1 overexpressing HeLa lysates and immobilized GST or GST-eps15 (595-896). Immunoblot with anti-FCHO1. Molecular mass standards (kDa) and intact FCHO1 (orange) and ΔμHD (black arrowheads) FCHO1 are indicated. (b) Pull-down assay using brain cytosol and either GST or 50 or 100 μg of the GST-μHD fusions indicated or the GST- αC appendage. Replicate immunoblots probed with the indicated antibodies with non-specific bands (asterisks) indicated. (c) Pull-down assay using HeLa lysate and either GST or 50 or 100 μg of the GST-μHD fusions indicated. Non-specific bands (asterisks) are indicated. All the GST-μHDs bind to eps15, eps15R, intersectin and Dab2 but only the FCHO1 μHD associates with Hrb, CALM, and clathrin. Note that different eps15 splice isoforms are present in HeLa lysates compared with brain (b). (d) Stained gel and replicate blots of first-stage assay pellets (red P) from incubations of brain cytosol with either GST or GST-FCHO2 μHD compared with supernatant (S) and pellets (P) from subsequent second-stage pull-downs with the supernatant fractions resulting from the first-stage incubations. (e) Cartoon of the eps15 C terminus with the relative positioning of the various truncations used indicated. (f) Pull-down assay using FCHO1 overexpressing HeLa lysate and the indicated GST-eps15 C-terminal fusions. Immunoblot with anti-FCHO1. (g) Stained gel and replicate blots from pull-down assays with GST or GST-FCHO1 μHD and HeLa lysates supplemented with 5 or 25 μM eps15 (595-660) peptide as indicated. (h) Interaction diagram for FCHO1/2 and select endocytic pioneer coat components. Presumptive contacts are indicated with dotted lines.
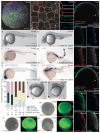
Figure 3
Developmental defects upon FCHO1 overexpression (a-c) Representative confocal optical section of 30% epiboly-stage (~5 hpf) embryo injected with a mcRFP-CAAX surface marker (80 pg) and GFP-FCHO1 (400 pg) mRNA after fixation and staining with an anti-AP-2 β2 subunit antibody. Subcellular localization (b) and color-separated enlargements (c) of the boxed region. Scale bar: 125 μm. (d-i) Representative morphology of 80 pg control or 200 pg human (Hs) FCHO1 mRNA-injected embryos at 24 hpf with no tail and sonic hedgehog mRNA expression patterns. Scale bar: 250 μm. (j) Quantitation of normal (pale blue), mild (navy blue) and moderate (violet) ventralized, or mild (yellow) and severe (brown) mRNA overexpression-induced dorsalized phenotypes, color-coded as in d-i. See Fig. 4 and 6 for complete categorization of the dorsalized and ventralized phenotypic classes. (k-l) Representative morphology of severely affected 200 pg truncated FCHO1 mRNA-expressing embryos. (m-s) pSmad1/5/8 localization in control (m, p, q), CA*alk8 (5 pg; n) or FCHO1 (400 pg; o, r, s) mRNA-injected early gastrulation embryos co-injected with 50 pg mcRFP-CAAX. Wide field (m-o; left) and fluorescence images (m-o; right)) or representative confocal sections (p, r) with color separated and merged enlargements (q, s) of the dorsal organizer region (arrows) shown. D, dorsal; V, ventral. Scale bars: 250 μm (m-o) or 125 μm (p, r).
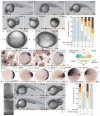
Figure 4
Fcho1 participates in early embryonic development (a-f) Representative images of the morphant phenotypic range on injection with 2 ng control or 2 ng fcho1 MO. C5-like morphants are rare and are grouped with the C4 class. Arrows: ventral fin defects. Scale bar: 250 μm. (g) Quantitation of dose-dependent fcho1 morphant phenotypes at 24 hpf, color coded as in a-f. (h-i) Typical vegetal pole view of 10 ng control or 10 ng fcho1 early-stage morphants at 10 hpf. A, anterior; P, posterior. Arrow: expanded A-P axis. Scale bar: 125 μm. (j-m) Representative mRNA expression patterns of both krox20 (brackets) and gata1 (arrows) in control (j, k) or 10 ng fcho1 MO-injected (l, m) 5-somite stage embryos. A, anterior; P, posterior. Group dorsal survey view: j, l; individual lateral view: k, m. Scale bar: 225 μm (j and l) or 125 μm (k, m). (n) Schematic cartoon depiction of the general location of opposing morphogen gradients that dictate DV patterning at shield stage. An, animal pole; Vg, vegetal pole; D, dorsal; V, ventral. (o-r) Representative mRNA expression patterns of indicated genes in 10 ng control (o and q) or fcho1 (p and r) shield-stage morphants. Relative expression zones (arrowhead in animal and bracket in lateral views) shown. Scale bar: 250 μm. (s-t) Dorsal view of gross morphology of developing notochord and somite regions of live 10 ng control (R) and fcho1 (S) morphants at the 6-somite stage. Scale bar: 50 μm. (u-x) representative phenotypes of 2 ng fcho1 morphants coinjected with indicated human (Hs) FCHO1 mRNA. Scale bar: 250 μm. (y) Quantitation of morphant phenotypes at 24 hpf.
Figure 5
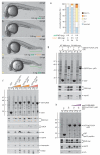
The Fcho1–Alk8 association (a-d). Representative images of live 24 hpf embryos after injection of 0.5 or 5 ng alk8 MO, 0.5 ng fcho1 MO or 0.5 ng each of alk8+fcho1 MOs. Defective ventral tail fin is bracketed (green). Scale bar: 250 μm. (e) Quantitation of single and double morphant phenotypes at 24 hpf. (f) Coomassie-stained gel and replicate blots from a pull-down assay using Alk8-myc overexpressing HeLa cell lysate and 150 μg immobilized GST or 50 or 150 μg human (Hs) GST-FCHO1 μHD or D. rerio (Dr) GST-Fcho1 or GST-Fcho2 μHDs. Alk8 (arrowheads in pellet (P) fractions) immunoblot with anti-myc. Note both bands of expressed Alk8-myc, probably differentially _N_-glycosylated forms, bind to the FCHO1/Fcho1 μHD. Non-specific bands (asterisks) are indicated. (g) Pull-down assay using wild-type (WT) or CA*Alk8-myc overexpressing HeLa cell lysate and immobilized GST or GST-Dr Fcho1 μHD. (h) Pull-down assay using Alk8-myc overexpressing HeLa cell lysate and immobilized GST or GST-Hs FCHO1 μHD. Addition of the eps15 (595-660) competitor peptide (5 or 25 μM) is indicated.
Figure 6
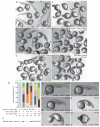
Fcho1 operates in a genetic Bmp-to-Smad signaling pathway (a-f) Group survey views of comparative morphology of injected control, 25 pg bmp2b with 100 pg bmp7 mRNA_,_ 5 ng each of fcho1+2+p53 MOs, bmp2b+bmp7 mRNA along with the fcho1+2+p53 MOs, 200 pg CA*smad1 mRNA, or the CA*smad1 mRNA along with the fcho1+2+p53 MOs-injected embryos at 24 hpf. Scale bar: 250 μm. (g) Quantitation of mRNA injected gain-of function (ventralized; black bracketed) and morphant (dorsalized; orange bracketed) phenotypes. The relevant unit for injected mRNA is pg and for MO is ng. (h-m) Representative images of the range and classification of ventralization phenotypes induced by injection of 25 pg bmp2b with 100 pg bmp7 mRNA at the 1-cell stage. Scale bar: 250 μm. (n) Schematic of the linear Bmp-dependent signaling pathway including the relative positioning of Fcho1.
Figure 7
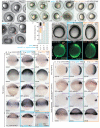
AP-2 morphants are unlike fcho1+2 double morphants (a-e) Representative survey views of comparative morphology of 10 ng control, ap2a1 or fcho1+2+p53 morphants at 14 (a, b) and 19 (c-e) hpf. Extruded yolk (arrowheads) and exploded/disintegrating (asterisk) embryos shown. Scale bars: 250 μm. (f) Quantitation of ap2a1 MO rescue with mouse (Mm) αC-subunit (Ap2a2) mRNA. (g-i) mRNA expression patterns of Fgf signaling genes in control (g), ap2a1 (h) or fcho1 (i) shield- or 30% epiboly-stage morphants. The zones of expanded expression (brackets) are indicated; D, dorsal; V, ventral. Scale bar: 250 μm. (j) Restoration of dusp6 expression in 30% epiboly (~5 hpf) ap2a1 MO embryos by coinjection of mouse Ap2a2 mRNA. Zone of expansion without rescue (brackets) indicated. (k-m) Fgf-dependent GFP expression in live embryos injected with 10 ng control, ap2a1 or fcho1+fcho2+p53 MOs. Delaminating ectoderm, broadly expanded GFP expression (arrowheads) in ap2a1, and diminished ventral tissue (bracket) in fcho1+2 morphants shown. A, anterior; P, posterior; mhb, mid-hindbrain boundary; r4, rhombomere 4; Kv, Kupfer’s vesicle. Elliptical fcho1 morphant (orange arrow) shown in m. Scale bar: 250 μm. (n-p) mRNA expression profiles of early patterning signaling components in control (n), ap2a1 (o) or fcho1 (p) shield- or 30% epiboly-stage morphants. Arrowheads and brackets show zones of expanded expression. Scale bar: 250 μm.
Figure 8
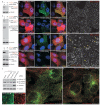
AP-2–clathrin coats persist in FCHO1 and FCHO2 siRNA-treated HeLa and BS-C-1 cells. (a) Biochemical validation of FCHO1 transcript silencing in GFP-FCHO1-expressing HeLa cells by immunoblot analysis of lysates from mock or FCHO1 siRNA transfected cells. An ON-TARGET plus SMART pool (siRNAp; Dharmacon) was used. Replicate immunoblot with an anti-β tubulin mAb to verify equivalent loading of lysates. (b) HeLa cells subject to mock, FCHO1 or FCHO2 siRNAp silencing and also ectopically expressing GFP-FCHO1 (along with RFP to mark co-transfected cells) were fixed and stained with Hoechst 33258. Representative, color-separated or merged, confocal optical sections are show. Note that both the FCHO1 and FCHO2 siRNAp sets efficiently quench the GFP-FCHO1 fluorescence. Scale bar: 10 μm. (c) Biochemical verification of FCHO2 siRNAp- or siRNAs-mediated silencing in HeLa cells by immunoblotting. SDS-PAGE resolved lysates from cells subjected to the indicated treatments were immunoblotted with antibodies against either GFP or FCHO2 and β tubulin as a loading control. Notice that the FCHO2 siRNAp suppresses both the transfected GFP-FCHO2 as well as the endogenous protein in these cell populations highly efficiently. (d-e) Representative single confocal optical sections of HeLa cells subjected to mock (d) or combined FCHO1+FCHO2 siRNAp (e) followed by fixation and immunodetection of the endogenous AP-2 α subunit using mAb AP.6. Note that although the roughly regular patterning and surface density of AP-2–clathrin structures is diminished upon knockdown of FCHO1/2, AP-2-positive puncta still persist and, generally appear to increase in size and are more irregularly deposited (arrowheads). (f) Biochemical verification of FCHO1+FCHO2 siRNAp- or siRNAs-mediated silencing in BS-C-1 cells by immunoblotting. Notice, again, that the Stealth (Invitrogen) FCHO2 siRNAs very effectively extinguishes the endogenous FCHO2 in these populations of cells. Mock transfected HeLa cells included for comparison. (g-j) Representative single confocal optical sections of clathrin LCa-GFP expressing BS-C-1 cells subjected to mock (g) or combined FCHO1 siRNAp+FCHO2 siRNAs (h) followed by fixation and immunodetection of the endogenous AP-2 α subunit using mAb AP.6. The insets (i, j) show a color-separated enlarged region corresponding to the boxed area in h. Surface AP-2-positive puncta clearly persist in these FCHO1+2-silenced BS-C-1 cells as well (arrowheads). Note that only a subset of clathrin-labeled structures is AP-2 positive in both the mock and FCHO1+2-silenced cells, as clathrin normally assembles on other intracellular structures as well. Scale bar: 10 μm.
Comment in
- Fishing for clathrin-coated pit nucleators.
Merrifield CJ. Merrifield CJ. Nat Cell Biol. 2012 May 2;14(5):452-4. doi: 10.1038/ncb2497. Nat Cell Biol. 2012. PMID: 22552146
Similar articles
- A clathrin coat assembly role for the muniscin protein central linker revealed by TALEN-mediated gene editing.
Umasankar PK, Ma L, Thieman JR, Jha A, Doray B, Watkins SC, Traub LM. Umasankar PK, et al. Elife. 2014 Oct 10;3:e04137. doi: 10.7554/eLife.04137. Elife. 2014. PMID: 25303365 Free PMC article. - Transient Fcho1/2⋅Eps15/R⋅AP-2 Nanoclusters Prime the AP-2 Clathrin Adaptor for Cargo Binding.
Ma L, Umasankar PK, Wrobel AG, Lymar A, McCoy AJ, Holkar SS, Jha A, Pradhan-Sundd T, Watkins SC, Owen DJ, Traub LM. Ma L, et al. Dev Cell. 2016 Jun 6;37(5):428-43. doi: 10.1016/j.devcel.2016.05.003. Epub 2016 May 26. Dev Cell. 2016. PMID: 27237791 Free PMC article. - Fishing for clathrin-coated pit nucleators.
Merrifield CJ. Merrifield CJ. Nat Cell Biol. 2012 May 2;14(5):452-4. doi: 10.1038/ncb2497. Nat Cell Biol. 2012. PMID: 22552146 - Sorting it out: AP-2 and alternate clathrin adaptors in endocytic cargo selection.
Traub LM. Traub LM. J Cell Biol. 2003 Oct 27;163(2):203-8. doi: 10.1083/jcb.200309175. J Cell Biol. 2003. PMID: 14581447 Free PMC article. Review. - Clathrin/AP-2-dependent endocytosis: a novel playground for the pharmacological toolbox?
Rodemer C, Haucke V. Rodemer C, et al. Handb Exp Pharmacol. 2008;(186):105-22. doi: 10.1007/978-3-540-72843-6_5. Handb Exp Pharmacol. 2008. PMID: 18491050 Review.
Cited by
- A clathrin coat assembly role for the muniscin protein central linker revealed by TALEN-mediated gene editing.
Umasankar PK, Ma L, Thieman JR, Jha A, Doray B, Watkins SC, Traub LM. Umasankar PK, et al. Elife. 2014 Oct 10;3:e04137. doi: 10.7554/eLife.04137. Elife. 2014. PMID: 25303365 Free PMC article. - Transient Fcho1/2⋅Eps15/R⋅AP-2 Nanoclusters Prime the AP-2 Clathrin Adaptor for Cargo Binding.
Ma L, Umasankar PK, Wrobel AG, Lymar A, McCoy AJ, Holkar SS, Jha A, Pradhan-Sundd T, Watkins SC, Owen DJ, Traub LM. Ma L, et al. Dev Cell. 2016 Jun 6;37(5):428-43. doi: 10.1016/j.devcel.2016.05.003. Epub 2016 May 26. Dev Cell. 2016. PMID: 27237791 Free PMC article. - The conserved protein adaptors CALM/AP180 and FCHo1/2 cooperatively recruit Eps15 to promote the initiation of clathrin-mediated endocytosis in yeast.
Sun Y, Yeam A, Kuo J, Iwamoto Y, Hu G, Drubin DG. Sun Y, et al. PLoS Biol. 2024 Sep 24;22(9):e3002833. doi: 10.1371/journal.pbio.3002833. eCollection 2024 Sep. PLoS Biol. 2024. PMID: 39316607 Free PMC article. - Human FCHO1 deficiency reveals role for clathrin-mediated endocytosis in development and function of T cells.
Łyszkiewicz M, Ziętara N, Frey L, Pannicke U, Stern M, Liu Y, Fan Y, Puchałka J, Hollizeck S, Somekh I, Rohlfs M, Yilmaz T, Ünal E, Karakukcu M, Patiroğlu T, Kellerer C, Karasu E, Sykora KW, Lev A, Simon A, Somech R, Roesler J, Hoenig M, Keppler OT, Schwarz K, Klein C. Łyszkiewicz M, et al. Nat Commun. 2020 Feb 25;11(1):1031. doi: 10.1038/s41467-020-14809-9. Nat Commun. 2020. PMID: 32098969 Free PMC article. - Endocytic accessory factors and regulation of clathrin-mediated endocytosis.
Merrifield CJ, Kaksonen M. Merrifield CJ, et al. Cold Spring Harb Perspect Biol. 2014 Oct 3;6(11):a016733. doi: 10.1101/cshperspect.a016733. Cold Spring Harb Perspect Biol. 2014. PMID: 25280766 Free PMC article. Review.
References
- Conner SD, Schmid SL. Regulated portals of entry into the cell. Nature. 2003;422:37–44. - PubMed
- McMahon HT, Boucrot E. Molecular mechanism and physiological functions of clathrin-mediated endocytosis. Nat Rev Mol Cell Biol. 2011;12:517–533. doi:nrm3151 [pii] 10.1038/nrm3151. - PubMed
- Kelly BT, Owen DJ. Endocytic sorting of transmembrane protein cargo. Curr Opin Cell Biol. 2011 doi:S0955-0674(11)00021-4 [pii] 10.1016/j.ceb.2011.03.004. - PubMed
Publication types
MeSH terms
Substances
Grants and funding
- R01 DK53249/DK/NIDDK NIH HHS/United States
- R01 DK053249/DK/NIDDK NIH HHS/United States
- R01 GM060979/GM/NIGMS NIH HHS/United States
- R01 HL088016/HL/NHLBI NIH HHS/United States
- R01 GM60979/GM/NIGMS NIH HHS/United States
LinkOut - more resources
Full Text Sources
Other Literature Sources
Molecular Biology Databases
Research Materials
