Population genetics models of local ancestry - PubMed (original) (raw)
Population genetics models of local ancestry
Simon Gravel. Genetics. 2012 Jun.
Abstract
Migrations have played an important role in shaping the genetic diversity of human populations. Understanding genomic data thus requires careful modeling of historical gene flow. Here we consider the effect of relatively recent population structure and gene flow and interpret genomes of individuals that have ancestry from multiple source populations as mosaics of segments originating from each population. This article describes general and tractable models for local ancestry patterns with a focus on the length distribution of continuous ancestry tracts and the variance in total ancestry proportions among individuals. The models offer improved agreement with Wright-Fisher simulation data when compared to the state-of-the art and can be used to infer time-dependent migration rates from multiple populations. Considering HapMap African-American (ASW) data, we find that a model with two distinct phases of "European" gene flow significantly improves the modeling of both tract lengths and ancestry variances.
Figures
Figure 1
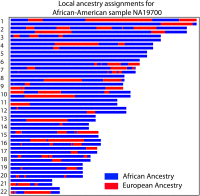
Local ancestry across 22 autosomes for an African-American individual inferred by PCAdmix, a local ancestry inference software (Brisbin 2010) using HapMap European (CEU) and Yoruba (YRI) as source populations. The majority of the genome is inferred to be of African origin (blue), but a significant fraction of the genome is inferred to be of European origin (red). The purpose of this article is to model the distribution of ancestry assignments in such admixed individuals.
Figure 2
(A) Illustration of an admixture model starting at generation T − 1, where the admixed population (purple) receiving mi(t) migrants from diverged red (i = 1) and blue (i = 2) source populations at generation t. If these are statistically distinct enough, it is possible to infer the ancestry along the admixed chromosomes. Independent of our statistical power to infer this detailed local ancestry, the mosaic pattern may leave distinct traces in genome-wide statistics, such as global ancestry or linkage patterns. (B) Gamete formation in two versions of the Wright–Fisher model with recombination. In model 1, diploid individuals are generated by randomly selecting two parents and generating gametes by following a Markov paths along the parental chromosomes. In model 2, gametes are generated by following a Markovian path across the parental allele pool. Both models have the same distribution of crossover numbers and are equivalent for genomic regions small enough that multiple crossovers are unlikely. Model 1 is more biologically realistic and is used in the simulations, whereas model 2 is more tractable and is used for inference and analytic derivations.
Figure 3
(A) A two-state Markov model for ancestry along a chromosome for a single pulse of migration at time _t_1. Tract-length distributions are exponential. (B) A three-population Markov model with a pulse of blue and red ancestry at time _t_1 followed by a pulse of migration from the yellow population at time _t_2. All tract-length distributions are exponential. (C) A two-population model in which the blue population contributes migrants at generation _t_1 and _t_2. The distribution of blue ancestry tracts is no longer exponential, as we cannot detect transitions between blue states.
Figure 4
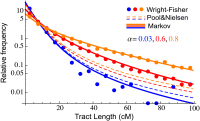
Comparison of the Markov model, the Pool and Nielsen (2009) prediction, and Wright–Fisher simulation for migrant tract length distributions. Each dot represents the normalized number of ancestry tracts whose length is contained in one of 20 bins. The simulation followed 10000 chromosomes over 30 generations, with constant migration rates m = 0.001, 0.03, 0.05 giving rise to final ancestry fractions of α = 0.03, 0.6, 0.8. Since recombination between migrant tracts were neglected in (Pool and Nielsen 2009), the results depart significantly from simulation at high migration, whereas the Markov model is accurate in the three regimes.
Figure 5
Distribution of continuous ancestry tract lengths in 20 HapMap African-American (ASW) trio individuals [as inferred by PCAdmix (Brisbin 2010), a local ancestry inference software], compared with predictions from a single-pulse migration model (top) and a model with subsequent European migration (bottom). Each dot represents the number of continuous ancestry tracts whose length is contained in one of 50 bins. The shaded area marks the 68.3% confidence interval based on the model. The second model, in which over 30% of European origin in the ASW samples is quite recent, provides a sufficiently better fit to justify the extra parameters (likelihood-ratio test, P = 0.002).
Figure 6
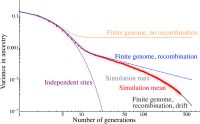
Comparison of 50 independent Wright–Fisher simulations of a population of 80 samples and 30% admixture proportion to predictions from increasingly detailed models. We show the variance in ancestry across individuals for each simulation in pale gray, and the average over the simulations is shown as red dots. These are compared to predictions for an independent sites model (purple) for a finite genome with 22 nonrecombining chromosomes (orange), for a model with recombination (blue), and finally for a model with recombination and drift given by Equation 8 (black). The latter model captures the variance in quantitative detail over three qualitative regimes.
Figure A1
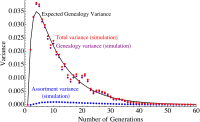
Time evolution of the variance for a population of 200 diploid individuals for a constant migration rate of 5% starting at generation 1. As the fraction of genetic ancestry originating from the migrant populations grows from 0 to 1, the variance reaches a maximum before the migration frequency reaches 0.5. Using the assumptions of Equation A19, we decompose the observed variance (red dots) in a genealogy (purple) and an assortment (blue) contribution. As expected, the genealogy contribution dominates.
Similar articles
- Detecting Heterogeneity in Population Structure Across the Genome in Admixed Populations.
McHugh C, Brown L, Thornton TA. McHugh C, et al. Genetics. 2016 Sep;204(1):43-56. doi: 10.1534/genetics.115.184184. Epub 2016 Jul 20. Genetics. 2016. PMID: 27440868 Free PMC article. - Increased genetic diversity of ADME genes in African Americans compared with their putative ancestral source populations and implications for pharmacogenomics.
Li J, Lao X, Zhang C, Tian L, Lu D, Xu S. Li J, et al. BMC Genet. 2014 May 1;15:52. doi: 10.1186/1471-2156-15-52. BMC Genet. 2014. PMID: 24884825 Free PMC article. - Exploring population admixture dynamics via empirical and simulated genome-wide distribution of ancestral chromosomal segments.
Jin W, Wang S, Wang H, Jin L, Xu S. Jin W, et al. Am J Hum Genet. 2012 Nov 2;91(5):849-62. doi: 10.1016/j.ajhg.2012.09.008. Epub 2012 Oct 25. Am J Hum Genet. 2012. PMID: 23103229 Free PMC article. - Understanding admixture fractions: theory and estimation of gene-flow.
Liang M, Shishkin M, Shchur V, Nielsen R. Liang M, et al. J Math Biol. 2024 Oct 4;89(5):47. doi: 10.1007/s00285-024-02146-0. J Math Biol. 2024. PMID: 39363040 - Genomic ancestry of North Africans supports back-to-Africa migrations.
Henn BM, Botigué LR, Gravel S, Wang W, Brisbin A, Byrnes JK, Fadhlaoui-Zid K, Zalloua PA, Moreno-Estrada A, Bertranpetit J, Bustamante CD, Comas D. Henn BM, et al. PLoS Genet. 2012 Jan;8(1):e1002397. doi: 10.1371/journal.pgen.1002397. Epub 2012 Jan 12. PLoS Genet. 2012. PMID: 22253600 Free PMC article.
Cited by
- Nested admixture during and after the Trans-Atlantic Slave Trade on the island of São Tomé.
Ciccarella M, Laurent R, Szpiech ZA, Patin E, Dessarps-Freichey F, Utgé J, Lémée L, Semo A, Rocha J, Verdu P. Ciccarella M, et al. bioRxiv [Preprint]. 2024 Oct 23:2024.10.21.619344. doi: 10.1101/2024.10.21.619344. bioRxiv. 2024. PMID: 39484499 Free PMC article. Preprint. - AncestryGrapher toolkit: Python command-line pipelines to visualize global- and local- ancestry inferences from the RFMIX version 2 software.
Lisi A, Campbell MC. Lisi A, et al. Bioinformatics. 2024 Nov 1;40(11):btae616. doi: 10.1093/bioinformatics/btae616. Bioinformatics. 2024. PMID: 39412440 Free PMC article. - Ancient Rapanui genomes reveal resilience and pre-European contact with the Americas.
Moreno-Mayar JV, Sousa da Mota B, Higham T, Klemm S, Gorman Edmunds M, Stenderup J, Iraeta-Orbegozo M, Laborde V, Heyer E, Torres Hochstetter F, Friess M, Allentoft ME, Schroeder H, Delaneau O, Malaspinas AS. Moreno-Mayar JV, et al. Nature. 2024 Sep;633(8029):389-397. doi: 10.1038/s41586-024-07881-4. Epub 2024 Sep 11. Nature. 2024. PMID: 39261618 Free PMC article. - Characterizing features affecting local ancestry inference performance in admixed populations.
Honorato-Mauer J, Shah NN, Maihofer AX, Zai CC, Belangero S, Nievergelt CM; Psychiatric Genomics Consortium for PTSD Ancestry Working Group; Santoro M, Atkinson E. Honorato-Mauer J, et al. bioRxiv [Preprint]. 2024 Aug 27:2024.08.26.609770. doi: 10.1101/2024.08.26.609770. bioRxiv. 2024. PMID: 39253486 Free PMC article. Preprint. - Differentiating mechanism from outcome for ancestry-assortative mating in admixed human populations.
Massey DJ, Szpiech ZA, Goldberg A. Massey DJ, et al. bioRxiv [Preprint]. 2024 Jun 6:2024.06.06.597727. doi: 10.1101/2024.06.06.597727. bioRxiv. 2024. PMID: 38895317 Free PMC article. Preprint.
References
- Bercovici S., Geiger D., 2009. Inferring ancestries efficiently in admixed populations with linkage disequilibrium. J. Comput. Biol. 16(8): 1141–1150 - PubMed
- Brisbin, A., 2010 Linkage analysis for categorical traits and ancestry assignment in admixed individuals. Ph.D. Thesis, Cornell University, Ithaca, NY.
Publication types
MeSH terms
Grants and funding
- R01 GM090087/GM/NIGMS NIH HHS/United States
- U01 HG005715/HG/NHGRI NIH HHS/United States
- U01HG005715/HG/NHGRI NIH HHS/United States
- 1 R01 GM090087-01/GM/NIGMS NIH HHS/United States
LinkOut - more resources
Full Text Sources
Other Literature Sources


