DDB2 promotes chromatin decondensation at UV-induced DNA damage - PubMed (original) (raw)
DDB2 promotes chromatin decondensation at UV-induced DNA damage
Martijn S Luijsterburg et al. J Cell Biol. 2012.
Abstract
Nucleotide excision repair (NER) is the principal pathway that removes helix-distorting deoxyribonucleic acid (DNA) damage from the mammalian genome. Recognition of DNA lesions by xeroderma pigmentosum group C (XPC) protein in chromatin is stimulated by the damaged DNA-binding protein 2 (DDB2), which is part of a CUL4A-RING ubiquitin ligase (CRL4) complex. In this paper, we report a new function of DDB2 in modulating chromatin structure at DNA lesions. We show that DDB2 elicits unfolding of large-scale chromatin structure independently of the CRL4 ubiquitin ligase complex. Our data reveal a marked adenosine triphosphate (ATP)-dependent reduction in the density of core histones in chromatin containing UV-induced DNA lesions, which strictly required functional DDB2 and involved the activity of poly(adenosine diphosphate [ADP]-ribose) polymerase 1. Finally, we show that lesion recognition by XPC, but not DDB2, was strongly reduced in ATP-depleted cells and was regulated by the steady-state levels of poly(ADP-ribose) chains.
Figures
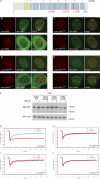
Figure 1.
Functional tethering of DDB2. (A) A schematic representation of murine DDB2 including mutations found in XP-E patients (in red). The seven WD40 β-propellers (1–7) and α-helical domain (α) are indicated. (B–E) Recruitment of GFP-DDB1 and GFP-CUL4A to tethered mCherry-LacR-DDB2 (B), mCherry-LacR-DDB2K244E (C), mCherry-LacR-DDB2D307Y (D), or mCherry-LacR-DDB2L350P (E). (F) Expression of GFP-DDB2 proteins in the absence (−) or presence (+) of proteasome inhibitor MG132 (10 µM). WB, Western blot; WT, wild type. (G–J) FRAP analysis of GFP-DDB2 (G), GFP-DDB2K244E (H), GFP-DDB2D307Y (I), or GFP-DDB2L350P (J) in unchallenged cells (blue lines) or globally (16 J/m2) UV-irradiated cells.
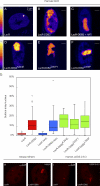
Figure 2.
DDB2 immobilization elicits extensive chromatin unfolding. (A–F) AO3 cells containing a 90-Mbp heterochromatic array were transfected with mCherry-LacR (A), mCherry-LacR-DDB2 in the absence (B) or presence (C) of HAT inhibitor (HATi), mCherry-LacR-DDB2K244E (D), mCherry-LacR-DDB2D307Y (E), or mCherry-LacR-DDB2L350P (F). Images show a confocal slice (1 Airy unit) of the nuclear distribution of the mCherry-LacR fusion proteins. The lookup table for the color coding is shown left of A and D. (G) Quantification of the relative array size (surface of the array/surface of the nucleus) is shown in a box plot (50–100 cells for each condition). Open circles are data points that are considered outliers, as their value is greater than the upper quartile, +1.5 the interquartile distance, or less than the lower quartile, −1.5 the interquartile distance. (H) Mouse NIH2/4 cells containing a 256x LacO array were transfected with mCherry-LacR (left) or mCherry-LacR-DDB2 (right). (I) Human U2OS 2–6-3 cells containing 200 copies of a LacO-containing cassette (∼4 Mbp) were transfected with mCherry-LacR (left) or mCherry-LacR-DDB2 (right).
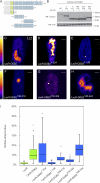
Figure 3.
Minimal DDB2 domain that is sufficient for chromatin unfolding. (A) A schematic representation of DDB2 deletion mutants analyzed. (B) Expression of mCherry-LacR–tagged DDB2 proteins in the absence (−) or presence (+) of proteasome inhibitor MG132 (10 µM). WB, Western blot; WT, wild type. (C–H) Images show a confocal slice (1 Airy unit) of the distribution of the indicated mCherry-LacR fusion proteins in AO3 cells. The lookup table is shown. (I) Quantification of array decondensation in AO3 cells (in ratio array/nucleus) after tethering the indicated LacR-DDB2 fusion proteins shown in a box plot. Values represent the mean array decondensation of 50–100 cells collected in two independent experiments. Open circles are data points that are considered outliers, as their value is greater than the upper quartile, +1.5 the interquartile distance, or less than the lower quartile, −1.5 the interquartile distance.
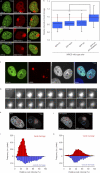
Figure 4.
UV-induced DNA lesions trigger ATP-dependent chromatin remodeling. (A–C) Distribution of GFP-tagged histones H1.0 (A), H2A (B), or H4 (C) at sites of local damage (100 J/m2) in MRC5 cells marked by the accumulation of DDB2-mCherry. (D) GFP-H4 and DDB2-mCherry distribution at local UV damage after ATP depletion. (E) Quantification of the intensity of GFP-tagged histones at sites of UV-induced DNA damage shown in a box plot (∼50 cells for each condition). An intensity of 1 represents the mean intensity in the nucleus (excluding nucleoli), and intensities <1 represent a reduced histone density in the locally damaged area. The dotted line represents a ratio of 1, which means that the intensity in the local damage is the same as the intensity elsewhere in the nucleus. Asterisks indicate significant differences based on a t test (P < 0.05). Open circles are data points that are considered outliers, as their value is greater than the upper quartile, +1.5 the interquartile distance, or less than the lower quartile, −1.5 the interquartile distance. (F) Distribution of GFP-H1 and DNA stained by DAPI in U2OS cells after local damage (100 J/m2) through 5-µm pores. Cells were stained for endogenous DDB2. (G) Real-time imaging of DDB2-YFP in living cells after local UV irradiation (100 J/m2 through 5-µm pores at 37°C) revealed the appearance of a fiberlike structure emanating from within the locally damaged area. (H and I) A micrograph (H) and quantitative (I) analysis of the distribution of GFP-H4 pixel intensities (normalized between 0 and 100%) inside the locally UV-damaged area (red circle in H and red bars in the histogram shown in I) or inside a similarly sized nondamaged area in the nucleus (blue circle in H and blue bars in the histogram shown in I). (J and K) Similar analysis for an ATP-depleted cell.
Figure 5.
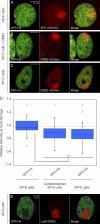
UV-induced chromatin changes require DDB2. (A–C) Distribution of GFP-H4 at sites of local damage (100 J/m2 through 5-µm pores) in a DDB2-deficient XP-E cell line XP23PV (A), an XP-E cell line complemented by transient expression of DDB2-mCherry to restore the DDB2 deficiency (B), and an XP-C cell line (C). (D) Quantification of the intensity of GFP-tagged histones at sites of UV-induced DNA damage shown in a box plot (∼50 cells for each condition). The dotted line represents a ratio of 1, which means that the intensity in the local damage is the same as the intensity elsewhere in the nucleus. Asterisks indicate significant differences based on a t test (P < 0.05). Open circles are data points that are considered outliers, as their value is greater than the upper quartile, +1.5 the interquartile distance, or less than the lower quartile, −1.5 the interquartile distance. (E) Distribution of GFP-H4 at the LacO array in AO3 cells upon tethering LacR-DDB2.
Figure 6.
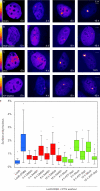
UV-induced chromatin changes require PARP1 activity. (A) Distribution of GFP-H4 at sites of local damage (100 J/m2 through 5-µm pores) in SWI/SNF-deficient C33A cells marked by the accumulation of DDB2-mCherry. (B and C) Distribution of GFP-H1 (B) or GFP-H4 (C) at sites of local damage (100 J/m2 through 5-µm pores) in U2OS that were either treated with DMSO (top rows) or 10 µM PARP inhibitor (PARPi) KU-0058948 for 3 h (bottom rows). (D) Western blot analysis of PARP1 expression levels after a single transfection or two consecutive transfections with siRNAs targeting luciferase (siLuc) or PARP1 (siPARP1) in U2OS cells. (E) Distribution of GFP-H4 at sites of local damage (100 J/m2 through 5-µm pores) in U2OS that were transfected twice with siLuc (top row) or siPARP1 (bottom row). (F) Quantification of the intensity of GFP-tagged histones at sites of UV-induced DNA damage shown in a box plot (between 50 and 100 cells for each condition in two independent experiments). The dotted line represents a ratio of 1, which means that the intensity in the local damage is the same as the intensity elsewhere in the nucleus. Asterisks indicate significant differences based on a t test (P < 0.05). Open circles are data points that are considered outliers, as their value is greater than the upper quartile, +1.5 the interquartile distance, or less than the lower quartile, −1.5 the interquartile distance.
Figure 7.
Chromatin unfolding by tethered DDB2 requires PARP activity and ATP hydrolysis. (A–D) Human U2OS 2–6-3 cells containing 200 copies of a LacO-containing cassette (∼4 Mbp) were transfected with mCherry-LacR-DDB2 in the presence of IPTG. Cells were subsequently released for the indicated time points in medium containing DMSO (A) or 1 µM PARP inhibitor (B) or in regular medium followed by a 30-min incubation in mock medium (C) or ATP depletion medium (D). The lookup table for the color coding is shown. (E) Quantitative measurements on the relative size of the array (surface of the array/surface of the nucleus) in cells subjected to the indicated conditions (30–50 cells for each condition collected in two independent experiments) are shown in a box plot. Open circles are data points that are considered outliers, as their value is greater than the upper quartile, +1.5 the interquartile distance, or less than the lower quartile, −1.5 the interquartile distance. depl., depleted; PARPi, PARP inhibitor.
Figure 8.
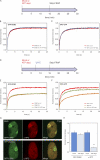
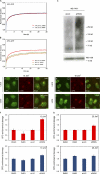
Lesion recognition by XPC is ATP dependent. (A) Cells stably expressing GFP-DDB2 (VH10) or XPC-GFP (XP4PA) were mock treated or ATP depleted (depl.) and subjected to Strip-FRAP analysis, as indicated. (B and C) Quantitative analysis of the mobility of GFP-DDB2 (B) or XPC-GFP (C) in unchallenged cells that were either mock treated (red lines) or ATP depleted (blue lines). (D) Cells stably expressing GFP-DDB2 or XPC-GFP were mock treated or ATP depleted, globally UV-C irradiated (8 J/m2), and subjected to Strip-FRAP analysis, as indicated. (E and F) Quantitative analysis of the mobility of GFP-DDB2 (E) or XPC-GFP (F) in unchallenged cells (red lines) or globally UV-irradiated, mock-treated (orange lines) or ATP-depleted (green lines) cells. Values represent the mean of ∼20 cells. (G) Examples of GFP-DDB2–expressing cells that were mock treated (top row) or ATP depleted (bottom row), locally UV irradiated (50 J/m2), and subsequently stained for endogenous XPC. (H) A quantification of the recruitment of GFP-DDB2 and endogenous XPC in the same cells is shown (∼30 cells for each condition). Error bars represent the SD. Asterisks indicate significant differences based on a t test (P < 0.01).
Figure 9.
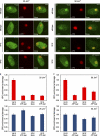
The impact of DDB2 deficiency and ATP depletion on XPC recruitment to DNA damage. (A and B) Wild-type VH10 cells (A) or XP-E (GMO1389-TERT) cells (B) were either mock treated (top rows) or ATP depleted (bottom rows), locally UV irradiated (25 J/m2 through 8-µm pores), and subsequently stained for endogenous XPC (green) and CPDs (red). (C and D) Wild-type VH10 cells (C) or XP-E (GMO1389-TERT) cells (D) were either mock treated (top rows) or ATP depleted (bottom rows), locally UV irradiated (50 J/m2 through 8-µm pores), and subsequently stained for endogenous XPC (green) and CPDs (red). (E and F) The quantification of the relative accumulation of XPC (red bars) or the enrichment of CPDs (blue bars) is shown in E (25 J/m2) and F (50 J/m2). The signal represents the relative increase at the locally damaged site relative to the signal in the nondamaged nuclear region (∼50 cells for each condition collected in two independent experiments). Error bars represent the SD. depl, depleted.
Figure 10.
Lesion recognition by XPC is PARP dependent. (A and B) Cells stably expressing XPC-GFP (XP4PA) were DMSO treated or PARP inhibitor (PARPi) treated and subjected to Strip-FRAP analysis, as indicated. Quantitative analysis of the mobility of XPC-GFP in unchallenged cells that were treated with DMSO or PARP inhibitor (A) or XPC-GFP in UV-C–irradiated (8 J/m2) cells that were treated with DMSO or PARP inhibitor (B) is shown. Values represent the mean of ∼20 cells. (C) Western blot (WB) of high–molecular mass PAR chains after transfection with siRNAs targeting luciferase (siLuc) or PARG (siPARG) in U2OS cells. Histone H2B serves as a loading control. (D) U2OS cells were treated with DMSO or PARP inhibitor, locally UV irradiated (10 J/m2 through 8-µm pores), and subsequently stained for endogenous XPC (green) and CPDs (red). (E) U2OS cells were transfected with siLUC or siPARG, locally UV irradiated (10 J/m2 through 8-µm pores), and subsequently stained for endogenous XPC (green) and CPDs (red). (F and G) The quantification of the relative accumulation of XPC (red bars) or the enrichment of CPDs (blue bars) is shown in F (10 J/m2) and G (25 J/m2). The signal represents the relative increase at the locally damaged site relative to the signal in the nondamaged nuclear region (∼50 cells for each condition collected in two independent experiments). Accumulation of XPC is normalized to 1 for comparison. So, DMSO is set to 1 (and PARPi expressed relative to this value), and siLUC is set to 1 (and siPARG expressed relative to this value). Error bars represent the SD.
Similar articles
- PARP1 promotes nucleotide excision repair through DDB2 stabilization and recruitment of ALC1.
Pines A, Vrouwe MG, Marteijn JA, Typas D, Luijsterburg MS, Cansoy M, Hensbergen P, Deelder A, de Groot A, Matsumoto S, Sugasawa K, Thoma N, Vermeulen W, Vrieling H, Mullenders L. Pines A, et al. J Cell Biol. 2012 Oct 15;199(2):235-49. doi: 10.1083/jcb.201112132. Epub 2012 Oct 8. J Cell Biol. 2012. PMID: 23045548 Free PMC article. - The cullin 4B-based UV-damaged DNA-binding protein ligase binds to UV-damaged chromatin and ubiquitinates histone H2A.
Guerrero-Santoro J, Kapetanaki MG, Hsieh CL, Gorbachinsky I, Levine AS, Rapić-Otrin V. Guerrero-Santoro J, et al. Cancer Res. 2008 Jul 1;68(13):5014-22. doi: 10.1158/0008-5472.CAN-07-6162. Cancer Res. 2008. PMID: 18593899 - Poly(ADP-ribose) polymerase 1 escorts XPC to UV-induced DNA lesions during nucleotide excision repair.
Robu M, Shah RG, Purohit NK, Zhou P, Naegeli H, Shah GM. Robu M, et al. Proc Natl Acad Sci U S A. 2017 Aug 15;114(33):E6847-E6856. doi: 10.1073/pnas.1706981114. Epub 2017 Jul 31. Proc Natl Acad Sci U S A. 2017. PMID: 28760956 Free PMC article. - Mechanism and regulation of DNA damage recognition in mammalian nucleotide excision repair.
Sugasawa K. Sugasawa K. Enzymes. 2019;45:99-138. doi: 10.1016/bs.enz.2019.06.004. Epub 2019 Jul 8. Enzymes. 2019. PMID: 31627884 Review. - Relation between carcinogenesis, chromatin structure and poly(ADP-ribosylation) (review).
Boulikas T. Boulikas T. Anticancer Res. 1991 Mar-Apr;11(2):489-527. Anticancer Res. 1991. PMID: 1905900 Review.
Cited by
- Nuclear Organization in Response to Stress: A Special Focus on Nucleoli.
Batnasan E, Koivukoski S, Kärkkäinen M, Latonen L. Batnasan E, et al. Results Probl Cell Differ. 2022;70:469-494. doi: 10.1007/978-3-031-06573-6_17. Results Probl Cell Differ. 2022. PMID: 36348119 - A protein with broad functions: damage-specific DNA-binding protein 2.
Bao N, Han J, Zhou H. Bao N, et al. Mol Biol Rep. 2022 Dec;49(12):12181-12192. doi: 10.1007/s11033-022-07963-4. Epub 2022 Oct 3. Mol Biol Rep. 2022. PMID: 36190612 Free PMC article. Review. - Global and transcription-coupled repair of 8-oxoG is initiated by nucleotide excision repair proteins.
Kumar N, Theil AF, Roginskaya V, Ali Y, Calderon M, Watkins SC, Barnes RP, Opresko PL, Pines A, Lans H, Vermeulen W, Van Houten B. Kumar N, et al. Nat Commun. 2022 Feb 21;13(1):974. doi: 10.1038/s41467-022-28642-9. Nat Commun. 2022. PMID: 35190564 Free PMC article. - Interplay between BRCA1 and GADD45A and Its Potential for Nucleotide Excision Repair in Breast Cancer Pathogenesis.
Pietrasik S, Zajac G, Morawiec J, Soszynski M, Fila M, Blasiak J. Pietrasik S, et al. Int J Mol Sci. 2020 Jan 29;21(3):870. doi: 10.3390/ijms21030870. Int J Mol Sci. 2020. PMID: 32013256 Free PMC article. Review. - ISWI chromatin remodeling complexes in the DNA damage response.
Aydin ÖZ, Vermeulen W, Lans H. Aydin ÖZ, et al. Cell Cycle. 2014;13(19):3016-25. doi: 10.4161/15384101.2014.956551. Cell Cycle. 2014. PMID: 25486562 Free PMC article.
References
- Alekseev S., Luijsterburg M.S., Pines A., Geverts B., Mari P.O., Giglia-Mari G., Lans H., Houtsmuller A.B., Mullenders L.H., Hoeijmakers J.H., Vermeulen W. 2008. Cellular concentrations of DDB2 regulate dynamic binding of DDB1 at UV-induced DNA damage. Mol. Cell. Biol. 28:7402–7413 10.1128/MCB.01108-08 - DOI - PMC - PubMed
- Chou D.M., Adamson B., Dephoure N.E., Tan X., Nottke A.C., Hurov K.E., Gygi S.P., Colaiácovo M.P., Elledge S.J. 2010. A chromatin localization screen reveals poly (ADP ribose)-regulated recruitment of the repressive polycomb and NuRD complexes to sites of DNA damage. Proc. Natl. Acad. Sci. USA. 107:18475–18480 10.1073/pnas.1012946107 - DOI - PMC - PubMed
Publication types
MeSH terms
Substances
LinkOut - more resources
Full Text Sources
Molecular Biology Databases
Miscellaneous
