Topological domains in mammalian genomes identified by analysis of chromatin interactions - PubMed (original) (raw)
Topological domains in mammalian genomes identified by analysis of chromatin interactions
Jesse R Dixon et al. Nature. 2012.
Abstract
The spatial organization of the genome is intimately linked to its biological function, yet our understanding of higher order genomic structure is coarse, fragmented and incomplete. In the nucleus of eukaryotic cells, interphase chromosomes occupy distinct chromosome territories, and numerous models have been proposed for how chromosomes fold within chromosome territories. These models, however, provide only few mechanistic details about the relationship between higher order chromatin structure and genome function. Recent advances in genomic technologies have led to rapid advances in the study of three-dimensional genome organization. In particular, Hi-C has been introduced as a method for identifying higher order chromatin interactions genome wide. Here we investigate the three-dimensional organization of the human and mouse genomes in embryonic stem cells and terminally differentiated cell types at unprecedented resolution. We identify large, megabase-sized local chromatin interaction domains, which we term 'topological domains', as a pervasive structural feature of the genome organization. These domains correlate with regions of the genome that constrain the spread of heterochromatin. The domains are stable across different cell types and highly conserved across species, indicating that topological domains are an inherent property of mammalian genomes. Finally, we find that the boundaries of topological domains are enriched for the insulator binding protein CTCF, housekeeping genes, transfer RNAs and short interspersed element (SINE) retrotransposons, indicating that these factors may have a role in establishing the topological domain structure of the genome.
Conflict of interest statement
The authors declare no competing financial interests.
Figures
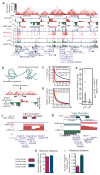
Figure 1. Topological Domains in the Mouse ES cell Genome
a, Normalized Hi-C interaction frequencies displayed as a 2D heatmap overlayed on ChIP-Seq data (from ref. 3), DI, HMM Bias State Calls, and domains. For both DI and HMM State calls, downstream bias (red) and upstream bias (green) are indicated. b, Schematic illustrating topological domains and resulting directional bias. c, Distribution of the DI (absolute value, in blue) compared to random (red). d, Mean interaction frequencies at all genomic distances between 40kb to 2Mb. Above 40kb, the intra-versus inter-domain interaction frequencies are significantly different (p < 0.005, Wilcoxan test). e, Box plot of all interaction frequencies at 80kb distance. Intra-domain interactions are enriched for high-frequency interactions. f–i, Diagram of “Intra-domain” (f) and “Inter-domain” FISH probes (g) and the genomic distance between pairs (h). i, Bar chart of the squared interprobe distance (from ref. 7) FISH probe pairs. Error bars indicate standard error (n = 100 for each probe pair).
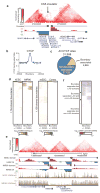
Figure 2. Topological Boundaries Demonstrate Classical Insulator or Barrier Elements Features
a, 2D heatmap surrounding the HoxA locus and CS5 insulator in IMR90 cells. b, Enrichment of CTCF at boundary regions. c, The portion of CTCF binding sites that are considered “associated” with a boundary (within +/− 20kb window is used as the expected uncertainty due to 40kb binning). d, Heat maps of H3K9me3 at boundary sites in human and mouse. e, UCSC Genome Browser shot showing heterochromatin spreading in the human ES cells and IMR90 cells. The 2D heat map shows the interaction frequency in hES cells. f, Heat map of LADs (from ref. 15) surrounding the boundary regions.
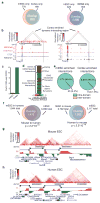
Figure 3. Boundaries are shared across cell types and conserved in evolution
a, Overlap of boundaries between cell types. b, Genome browser shot of a cortex enriched dynamic interacting region that overlaps with the Foxg1 gene. c, Foxg1 expression in mouse ES cells and cortex as measured by RNA-seq. d, Heat map of the gene expression ratio between mouse ES cell and cortex of genes at dynamic interactions. e, Pie chart of inter- and intra-domain dynamic interactions. f, Overlap of boundaries between syntenic mouse and human sequences (p-value < 2.2*10−16 compared to random, Fisher’s exact test). g and h, Genome browser shots showing domain structure over a syntenic region in the mouse (g) and human ES cells (h). Note: the region in humans has been inverted from its normal UCSC coordinates for proper display purposes.
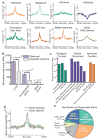
Figure 4. Boundary regions are enriched for housekeeping genes
a, Chromatin modifications, TSS, GRO-Seq, and SINE elements surrounding boundary regions in mESCs or IMR90. b, Boundaries associated with a CTCF binding site, housekeeping gene, or tRNA gene (purple) compared to expected at random (grey). c, Gene Ontology p-value chart. d, Enrichment of housekeeping genes (gold) and tissue specific genes (blue) as defined by on Shannon entropy scores near boundaries normalized for the number of genes in each class (TSS/10kb/total TSS). e, Percentage of boundaries with a given mark within 20kb of the boundaries.
Similar articles
- Comparative Hi-C reveals that CTCF underlies evolution of chromosomal domain architecture.
Vietri Rudan M, Barrington C, Henderson S, Ernst C, Odom DT, Tanay A, Hadjur S. Vietri Rudan M, et al. Cell Rep. 2015 Mar 3;10(8):1297-309. doi: 10.1016/j.celrep.2015.02.004. Epub 2015 Feb 26. Cell Rep. 2015. PMID: 25732821 Free PMC article. - Topologically associating domains are stable units of replication-timing regulation.
Pope BD, Ryba T, Dileep V, Yue F, Wu W, Denas O, Vera DL, Wang Y, Hansen RS, Canfield TK, Thurman RE, Cheng Y, Gülsoy G, Dennis JH, Snyder MP, Stamatoyannopoulos JA, Taylor J, Hardison RC, Kahveci T, Ren B, Gilbert DM. Pope BD, et al. Nature. 2014 Nov 20;515(7527):402-5. doi: 10.1038/nature13986. Nature. 2014. PMID: 25409831 Free PMC article. - Insulator function and topological domain border strength scale with architectural protein occupancy.
Van Bortle K, Nichols MH, Li L, Ong CT, Takenaka N, Qin ZS, Corces VG. Van Bortle K, et al. Genome Biol. 2014 Jun 30;15(6):R82. doi: 10.1186/gb-2014-15-5-r82. Genome Biol. 2014. PMID: 24981874 Free PMC article. - Chromatin Domains: The Unit of Chromosome Organization.
Dixon JR, Gorkin DU, Ren B. Dixon JR, et al. Mol Cell. 2016 Jun 2;62(5):668-80. doi: 10.1016/j.molcel.2016.05.018. Mol Cell. 2016. PMID: 27259200 Free PMC article. Review. - Genome-wide studies of CCCTC-binding factor (CTCF) and cohesin provide insight into chromatin structure and regulation.
Lee BK, Iyer VR. Lee BK, et al. J Biol Chem. 2012 Sep 7;287(37):30906-13. doi: 10.1074/jbc.R111.324962. Epub 2012 Sep 5. J Biol Chem. 2012. PMID: 22952237 Free PMC article. Review.
Cited by
- Efficient and easy-to-use capturing three-dimensional metagenome interactions with GutHi-C.
Lu YX, Yang JB, Li CY, Tian YH, Chang RR, Kong DS, Yang SL, Wang YF, Zhang YB, Zhu XS, Pan WH, Kong SY. Lu YX, et al. Imeta. 2024 Jul 22;3(5):e227. doi: 10.1002/imt2.227. eCollection 2024 Oct. Imeta. 2024. PMID: 39429879 Free PMC article. - coiTAD: Detection of Topologically Associating Domains Based on Clustering of Circular Influence Features from Hi-C Data.
Houchens D, Chowdhury HMAM, Oluwadare O. Houchens D, et al. Genes (Basel). 2024 Sep 30;15(10):1293. doi: 10.3390/genes15101293. Genes (Basel). 2024. PMID: 39457417 Free PMC article. - Site-specific silencing of regulatory elements as a mechanism of X inactivation.
Calabrese JM, Sun W, Song L, Mugford JW, Williams L, Yee D, Starmer J, Mieczkowski P, Crawford GE, Magnuson T. Calabrese JM, et al. Cell. 2012 Nov 21;151(5):951-63. doi: 10.1016/j.cell.2012.10.037. Cell. 2012. PMID: 23178118 Free PMC article. - A subset of Drosophila Myc sites remain associated with mitotic chromosomes colocalized with insulator proteins.
Yang J, Sung E, Donlin-Asp PG, Corces VG. Yang J, et al. Nat Commun. 2013;4:1464. doi: 10.1038/ncomms2469. Nat Commun. 2013. PMID: 23403565 Free PMC article. - R-chie: a web server and R package for visualizing cis and trans RNA-RNA, RNA-DNA and DNA-DNA interactions.
Tsybulskyi V, Mounir M, Meyer IM. Tsybulskyi V, et al. Nucleic Acids Res. 2020 Oct 9;48(18):e105. doi: 10.1093/nar/gkaa708. Nucleic Acids Res. 2020. PMID: 32976561 Free PMC article.
References
- Yaffe E, Tanay A. Probabilistic modeling of Hi-C contact maps eliminates systematic biases to characterize global chromosomal architecture. Nat Genet. 43:1059–65. - PubMed
Publication types
MeSH terms
Substances
Grants and funding
- R01 HG003991/HG/NHGRI NIH HHS/United States
- R01 HG003991-03/HG/NHGRI NIH HHS/United States
- R01 HG003991-03S1/HG/NHGRI NIH HHS/United States
- R01GH003991/GH/CGH CDC HHS/United States
LinkOut - more resources
Full Text Sources
Other Literature Sources
Molecular Biology Databases


