Identification of somatic mutations in non-small cell lung carcinomas using whole-exome sequencing - PubMed (original) (raw)
doi: 10.1093/carcin/bgs148. Epub 2012 Apr 17.
Carl Morrison, Liang Wang, Donghai Xiong, Peter Vedell, Peng Cui, Xing Hua, Feng Ding, Yan Lu, Michael James, John D Ebben, Haiming Xu, Alex A Adjei, Karen Head, Jaime W Andrae, Michael R Tschannen, Howard Jacob, Jing Pan, Qi Zhang, Francoise Van den Bergh, Haijie Xiao, Ken C Lo, Jigar Patel, Todd Richmond, Mary-Anne Watt, Thomas Albert, Rebecca Selzer, Marshall Anderson, Jiang Wang, Yian Wang, Sandra Starnes, Ping Yang, Ming You
Affiliations
- PMID: 22510280
- PMCID: PMC3499051
- DOI: 10.1093/carcin/bgs148
Identification of somatic mutations in non-small cell lung carcinomas using whole-exome sequencing
Pengyuan Liu et al. Carcinogenesis. 2012 Jul.
Abstract
Lung cancer is the leading cause of cancer-related death, with non-small cell lung cancer (NSCLC) being the predominant form of the disease. Most lung cancer is caused by the accumulation of genomic alterations due to tobacco exposure. To uncover its mutational landscape, we performed whole-exome sequencing in 31 NSCLCs and their matched normal tissue samples. We identified both common and unique mutation spectra and pathway activation in lung adenocarcinomas and squamous cell carcinomas, two major histologies in NSCLC. In addition to identifying previously known lung cancer genes (TP53, KRAS, EGFR, CDKN2A and RB1), the analysis revealed many genes not previously implicated in this malignancy. Notably, a novel gene CSMD3 was identified as the second most frequently mutated gene (next to TP53) in lung cancer. We further demonstrated that loss of CSMD3 results in increased proliferation of airway epithelial cells. The study provides unprecedented insights into mutational processes, cellular pathways and gene networks associated with lung cancer. Of potential immediate clinical relevance, several highly mutated genes identified in our study are promising druggable targets in cancer therapy including ALK, CTNNA3, DCC, MLL3, PCDHIIX, PIK3C2B, PIK3CG and ROCK2.
Figures
Fig. 1.
Significantly mutated genes in lung cancer. Red circles represent genes mutated in both ADC and SCC; blue circles represent genes mutated only in ADC and green circles represent genes mutated only in SCC. P values represent the evidence of a gene having higher mutation rate than its background mutation rate. The new Poisson model for mutational process was described in
Supplementary data
.
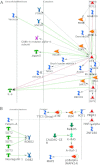
Fig. 2.
Direct interaction networks. (A) Frequently mutated genes observed in both ADC and SCC. (B) ADC-specific genes. (C) SCC-specific genes. Only clusters with visible interactions (not genes of the same complex) are shown. The direct of action is arranged to be mostly from left to right. The color of the edges or connecting lines indicate the type of regulation (activation: green, inhibition: red and unspecified: gray). Arrows indicated the direction of the interaction with the arrow pointing to the gene being acted on. The meaning of the symbols in the network is presented in
Supplementary data
.
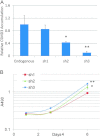
Fig. 3.
Knockdown of CSMD3 in airway epithelial cells. (A) Real-time PCR quantitation of CSMD3 transcript levels relative to endogenous levels for pooled populations of cells infection with short-hairpin RNA vectors targeting CSMD3 and selection. All data is normalized to actin signal for each sample. *P = 0.008, **P = 0.001. P values were obtained using two-tailed Student's _t_-test and represent significance of difference from endogenous levels. Error bars represent standard error from the mean. Data points represent triplicate assays. (B) Growth curves of Beas-2b cells with CSMD3 knockdown vectors. Cell viability was determined over 8 days in culture by MTS assay. *P = 0.003, **P = 0.000013. P values were obtained using two-tailed Student's _t_-test and represent significance of difference in Day 6 values from sh1. Error bars represent 1 SD from the mean.
References
- Siegel R, et al. Cancer statistics, 2011: the impact of eliminating socioeconomic and racial disparities on premature cancer deaths. CA Cancer J. Clin. 2011;61:212–236. - PubMed
- Wistuba II, et al. Molecular genetics of small cell lung carcinoma. Semin. Oncol. 2001;28:3–13. - PubMed
- Mori N, et al. Variable mutations of the RB gene in small-cell lung carcinoma. Oncogene. 1990;5:1713–1717. - PubMed
- Yokomizo A, et al. PTEN/MMAC1 mutations identified in small cell, but not in non-small cell lung cancers. Oncogene. 1998;17:475–479. - PubMed
Publication types
MeSH terms
Grants and funding
- R01CA80127/CA/NCI NIH HHS/United States
- R01CA113793/CA/NCI NIH HHS/United States
- R01CA84354/CA/NCI NIH HHS/United States
- R01CA134682/CA/NCI NIH HHS/United States
- R01CA129533/CA/NCI NIH HHS/United States
LinkOut - more resources
Full Text Sources
Medical
Research Materials
Miscellaneous


