Facilities for macromolecular crystallography at the Helmholtz-Zentrum Berlin - PubMed (original) (raw)
Facilities for macromolecular crystallography at the Helmholtz-Zentrum Berlin
Uwe Mueller et al. J Synchrotron Radiat. 2012 May.
Abstract
Three macromolecular crystallography (MX) beamlines at the Helmholtz-Zentrum Berlin (HZB) are available for the regional, national and international structural biology user community. The state-of-the-art synchrotron beamlines for MX BL14.1, BL14.2 and BL14.3 are located within the low-β section of the BESSY II electron storage ring. All beamlines are fed from a superconducting 7 T wavelength-shifter insertion device. BL14.1 and BL14.2 are energy tunable in the range 5-16 keV, while BL14.3 is a fixed-energy side station operated at 13.8 keV. All three beamlines are equipped with CCD detectors. BL14.1 and BL14.2 are in regular user operation providing about 200 beam days per year and about 600 user shifts to approximately 50 research groups across Europe. BL14.3 has initially been used as a test facility and was brought into regular user mode operation during the year 2010. BL14.1 has recently been upgraded with a microdiffractometer including a mini-κ goniometer and an automated sample changer. Additional user facilities include office space adjacent to the beamlines, a sample preparation laboratory, a biology laboratory (safety level 1) and high-end computing resources. In this article the instrumentation of the beamlines is described, and a summary of the experimental possibilities of the beamlines and the provided ancillary equipment for the user community is given.
Figures
Figure 1
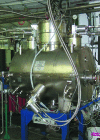
The 7T-WLS installed in the low-β section 14 of the BESSY II storage ring.
Figure 2
Photon flux of beamlines BL14.1, BL14.2 and BL14.3 as a function of energy.
Figure 3
Upstream view of the joint optics hutch. BL14.2 and BL14.3 comprise the left part of the image, BL14.1 the right. The open green sliding door on the right-hand side is the only access to the optics hutch.
Figure 4
Schematics of the beamline layout for beamlines BL14.1, BL14.2 and BL14.3. The three beamlines are horizontally separated by the usage of the 40 mrad broad synchrotron beam fan. The BESSY storage ring wall is located at the downstream side of the primary beam-shutter.
Figure 5
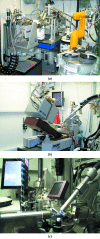
Experimental stations instrumentations: (a) BL14.1, (b) BL14.2, (c) BL14.3.
Figure 6
Three-dimensional drawing of the MX beamline optics (left) and experimental hutches (centre) as well as the experiment control room and sample preparation laboratory (upper right). Beamline order from top to bottom: BL14.1, BL14.2, BL14.3.
Figure 7
Ancillary facilities of the MX beamlines. (a) UV-RIP set-up on BL14.1. The crystal which is exposed to UV irradiation can easily be seen owing to its fluorescence, (b) In situ crystal screening of 96-well plates centred within the X-ray beam of BL14.1. (c) Noble gas pressure cell for Xe and Kr derivatizations (
http://www.hamptonresearch.com/
). (d) HC1c dehydration device mounted on BL14.3. (e) Cryo-shutter annealing device at BL14, with microdiffractometer MD2 and mini-κ MK3. (f) Results from the cryo-shutter operation (the device mounted on all beamlines); the image shows a diffraction pattern before (left) and after (right) cryo-annealing.
Figure 8
Histogram of released protein structure coordinates per year from the PDB (data were taken from the BioSync web page,
). As a consequence of the 12-months hold on deposited structures, the deposition numbers for 2011 will only be finalized by the end of 2012. Status from 9 February 2012.
Figure 9
Representative examples of research highlights from diffraction data collected at the HZB MX beamlines. (a) Meta II rhodopsin structure (Choe et al., 2011 ▶), (b) 66.3 kDa protein structure solved by S-SAD (Lakomek et al., 2009 ▶), (c) α1-acid glycoprotein solved by UV-RIP with highlighted disulfide bonds and contoured +4.5σ and −4.5σ (green and red, respectively) F before − F after difference density (Schönfeld et al., 2008 ▶).
Similar articles
- Workflow and Tools for Crystallographic Fragment Screening at the Helmholtz-Zentrum Berlin.
Wollenhaupt J, Barthel T, Lima GMA, Metz A, Wallacher D, Jagudin E, Huschmann FU, Hauß T, Feiler CG, Gerlach M, Hellmig M, Förster R, Steffien M, Heine A, Klebe G, Mueller U, Weiss MS. Wollenhaupt J, et al. J Vis Exp. 2021 Mar 3;(169). doi: 10.3791/62208. J Vis Exp. 2021. PMID: 33749678 - MxCuBE: a synchrotron beamline control environment customized for macromolecular crystallography experiments.
Gabadinho J, Beteva A, Guijarro M, Rey-Bakaikoa V, Spruce D, Bowler MW, Brockhauser S, Flot D, Gordon EJ, Hall DR, Lavault B, McCarthy AA, McCarthy J, Mitchell E, Monaco S, Mueller-Dieckmann C, Nurizzo D, Ravelli RB, Thibault X, Walsh MA, Leonard GA, McSweeney SM. Gabadinho J, et al. J Synchrotron Radiat. 2010 Sep;17(5):700-7. doi: 10.1107/S0909049510020005. Epub 2010 Jul 13. J Synchrotron Radiat. 2010. PMID: 20724792 Free PMC article. - A decade of user operation on the macromolecular crystallography MAD beamline ID14-4 at the ESRF.
McCarthy AA, Brockhauser S, Nurizzo D, Theveneau P, Mairs T, Spruce D, Guijarro M, Lesourd M, Ravelli RB, McSweeney S. McCarthy AA, et al. J Synchrotron Radiat. 2009 Nov;16(Pt 6):803-12. doi: 10.1107/S0909049509035377. Epub 2009 Oct 7. J Synchrotron Radiat. 2009. PMID: 19844017 Free PMC article. - Application of in situ diffraction in high-throughput structure determination platforms.
Aller P, Sanchez-Weatherby J, Foadi J, Winter G, Lobley CM, Axford D, Ashton AW, Bellini D, Brandao-Neto J, Culurgioni S, Douangamath A, Duman R, Evans G, Fisher S, Flaig R, Hall DR, Lukacik P, Mazzorana M, McAuley KE, Mykhaylyk V, Owen RL, Paterson NG, Romano P, Sandy J, Sorensen T, von Delft F, Wagner A, Warren A, Williams M, Stuart DI, Walsh MA. Aller P, et al. Methods Mol Biol. 2015;1261:233-53. doi: 10.1007/978-1-4939-2230-7_13. Methods Mol Biol. 2015. PMID: 25502203 Review. - Automation of macromolecular crystallography beamlines.
Arzt S, Beteva A, Cipriani F, Delageniere S, Felisaz F, Förstner G, Gordon E, Launer L, Lavault B, Leonard G, Mairs T, McCarthy A, McCarthy J, McSweeney S, Meyer J, Mitchell E, Monaco S, Nurizzo D, Ravelli R, Rey V, Shepard W, Spruce D, Svensson O, Theveneau P. Arzt S, et al. Prog Biophys Mol Biol. 2005 Oct;89(2):124-52. doi: 10.1016/j.pbiomolbio.2004.09.003. Prog Biophys Mol Biol. 2005. PMID: 15910915 Review.
Cited by
- Structure of the unliganded form of the proprotein convertase furin suggests activation by a substrate-induced mechanism.
Dahms SO, Arciniega M, Steinmetzer T, Huber R, Than ME. Dahms SO, et al. Proc Natl Acad Sci U S A. 2016 Oct 4;113(40):11196-11201. doi: 10.1073/pnas.1613630113. Epub 2016 Sep 19. Proc Natl Acad Sci U S A. 2016. PMID: 27647913 Free PMC article. - Oligomeric interface modulation causes misregulation of purine 5´-nucleotidase in relapsed leukemia.
Hnízda A, Škerlová J, Fábry M, Pachl P, Šinalová M, Vrzal L, Man P, Novák P, Řezáčová P, Veverka V. Hnízda A, et al. BMC Biol. 2016 Oct 19;14(1):91. doi: 10.1186/s12915-016-0313-y. BMC Biol. 2016. PMID: 27756303 Free PMC article. - Elucidating the Unconventional Binding Mode of a DNA-Encoded Library Hit Provides a Blueprint for Sirtuin 6 Inhibitor Development.
You W, Montoya AL, Dana S, Franzini RM, Steegborn C. You W, et al. ChemMedChem. 2024 Oct 16;19(20):e202400273. doi: 10.1002/cmdc.202400273. Epub 2024 Aug 19. ChemMedChem. 2024. PMID: 38940296 Free PMC article. - Structures of two bacterial resistance factors mediating tRNA-dependent aminoacylation of phosphatidylglycerol with lysine or alanine.
Hebecker S, Krausze J, Hasenkampf T, Schneider J, Groenewold M, Reichelt J, Jahn D, Heinz DW, Moser J. Hebecker S, et al. Proc Natl Acad Sci U S A. 2015 Aug 25;112(34):10691-6. doi: 10.1073/pnas.1511167112. Epub 2015 Aug 10. Proc Natl Acad Sci U S A. 2015. PMID: 26261323 Free PMC article. - Crystal structure of carbonic anhydrase CaNce103p from the pathogenic yeast Candida albicans.
Dostál J, Brynda J, Blaha J, Macháček S, Heidingsfeld O, Pichová I. Dostál J, et al. BMC Struct Biol. 2018 Oct 26;18(1):14. doi: 10.1186/s12900-018-0093-4. BMC Struct Biol. 2018. PMID: 30367660 Free PMC article.
References
- Choe, H. W., Kim, Y. J., Park, J. H., Morizumi, T., Pai, E. F., Krauss, N., Hofmann, K. P., Scheerer, P. & Ernst, O. P. (2011). Nature (London), 471, 651–655. - PubMed
- Cipriani, F., Felisaz, F., Launer, L., Aksoy, J.-S., Caserotto, H., Cusack, S., Dallery, M., di-Chiaro, F., Guijarro, M., Huet, J., Larsen, S., Lentini, M., McCarthy, J., McSweeney, S., Ravelli, R., Renier, M., Taffut, C., Thompson, A., Leonard, G. A. & Walsh, M. A. (2006). Acta Cryst. D62, 1251–1259. - PubMed
- Dudzik, E., Feyerherm, R., Diete, W., Signorato, R. & Zilkens, C. (2006). J. Synchrotron Rad. 13, 421–425. - PubMed
- Erko, A., Packe, I., Gudat, W., Abrosimov, N. & Firsov, A. (2001). Nucl. Instrum. Methods Phys. Res. A, 467, 623–626.
Publication types
MeSH terms
Substances
LinkOut - more resources
Full Text Sources
Other Literature Sources


