Diversity patterns and activity of uncultured marine heterotrophic flagellates unveiled with pyrosequencing - PubMed (original) (raw)
Diversity patterns and activity of uncultured marine heterotrophic flagellates unveiled with pyrosequencing
Ramiro Logares et al. ISME J. 2012 Oct.
Abstract
Flagellated heterotrophic microeukaryotes have key roles for the functioning of marine ecosystems as they channel large amounts of organic carbon to the upper trophic levels and control the population sizes of bacteria and archaea. Still, we know very little on the diversity patterns of most groups constituting this evolutionary heterogeneous assemblage. Here, we investigate 11 groups of uncultured flagellates known as MArine STramenopiles (MASTs). MASTs are ecologically very important and branch at the base of stramenopiles. We explored the diversity patterns of MASTs using pyrosequencing (18S rDNA) in coastal European waters. We found that MAST groups range from highly to lowly diversified. Pyrosequencing (hereafter '454') allowed us to approach to the limits of taxonomic diversity for all MAST groups, which varied in one order of magnitude (tens to hundreds) in terms of operational taxonomic units (98% similarity). We did not evidence large differences in activity, as indicated by ratios of DNA:RNA-reads. Most groups were strictly planktonic, although we found some groups that were active in sediments and even in anoxic waters. The proportion of reads per size fraction indicated that most groups were composed of very small cells (∼2-5 μm). In addition, phylogenetically different assemblages appeared to be present in different size fractions, depths and geographic zones. Thus, MAST diversity seems to be highly partitioned in spatial scales. Altogether, our results shed light on these ecologically very important but poorly known groups of uncultured marine flagellates.
Figures
Figure 1
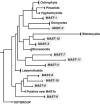
Schematic stramenopile phylogeny indicating the position of MAST groups. Based on a modified version of Supplementary Figure S1.
Figure 2
Comparison of the stramenopile diversity retrieved by Sanger and 454 sequencing. When the same number of sequences is sampled, 454 and Sanger retrieve very similar numbers of OTUs at the whole clustering threshold range. When all 454 reads are analyzed, the extra diversity retrieved by 454 becomes apparent. Note that most of the new diversity brought by 454 is located within the 3% of divergence area and thus could be associated to microdiversity. Only unique sequences have been analyzed here, and all data sets were treated equally during clustering. The complete chimera-checked 454 data set contained 26 651 sequences, while the subsampled had 5480 sequences.
Figure 3
Distribution of the similarities (percentage of identity) between the 26 651 stramenopile reads and the Sanger stramenopile sequences at NCBI-nr (version May 2011). Only hits that aligned >300 bp to the query were considered. Note that most of the MAST diversity recovered by 454 was >98% similar to Sanger sequences already present at NCBI-nr.
Figure 4
Phylogenetic diversity for the different MAST groups based on 454 reads. A rarefaction curve based on 1000 randomizations is presented, as phylogenetic diversity is dependent of sample size.
Figure 5
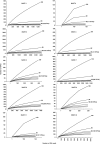
Rarefaction analysis for the different MAST groups based on 454 reads using clustering thresholds between 100 and 95% (only the curves with the thresholds 100, 99 and 98 are indicated). The final number of OTUs at 98% is indicated in brackets. Note that at 98% clustering, the curves for most groups tend to become parallel to the _x_-axis, indicating diversity saturation for that level.
Figure 6
Percentage of the total number of reads represented by all MASTs in samples from different geographic locations. n indicates the number of samples; *anoxic samples.
Figure 7
Percentage of the total number of MAST reads in samples from different size fractions (0.8–3.0 and 3.0–20 μm) as well as from sediments. Values for each MAST group are presented considering the used template (DNA or RNA). Note that the ratio DNA:RNA can provide an indication of activity within each size fraction or in sediments. The symbol ‘*' indicates that the difference between DNA and RNA was significant in MAST-8 (Kruskal–Wallis, P<0.05). The absence of ‘*' indicates lack of significance.
Similar articles
- Exploring the uncultured microeukaryote majority in the oceans: reevaluation of ribogroups within stramenopiles.
Massana R, del Campo J, Sieracki ME, Audic S, Logares R. Massana R, et al. ISME J. 2014 Apr;8(4):854-66. doi: 10.1038/ismej.2013.204. Epub 2013 Nov 7. ISME J. 2014. PMID: 24196325 Free PMC article. - Marine protist diversity in European coastal waters and sediments as revealed by high-throughput sequencing.
Massana R, Gobet A, Audic S, Bass D, Bittner L, Boutte C, Chambouvet A, Christen R, Claverie JM, Decelle J, Dolan JR, Dunthorn M, Edvardsen B, Forn I, Forster D, Guillou L, Jaillon O, Kooistra WH, Logares R, Mahé F, Not F, Ogata H, Pawlowski J, Pernice MC, Probert I, Romac S, Richards T, Santini S, Shalchian-Tabrizi K, Siano R, Simon N, Stoeck T, Vaulot D, Zingone A, de Vargas C. Massana R, et al. Environ Microbiol. 2015 Oct;17(10):4035-49. doi: 10.1111/1462-2920.12955. Epub 2015 Aug 4. Environ Microbiol. 2015. PMID: 26119494 - Distribution and abundance of uncultured heterotrophic flagellates in the world oceans.
Massana R, Terrado R, Forn I, Lovejoy C, Pedrós-Alió C. Massana R, et al. Environ Microbiol. 2006 Sep;8(9):1515-22. doi: 10.1111/j.1462-2920.2006.01042.x. Environ Microbiol. 2006. PMID: 16913912 - Eukaryotic picoplankton in surface oceans.
Massana R. Massana R. Annu Rev Microbiol. 2011;65:91-110. doi: 10.1146/annurev-micro-090110-102903. Annu Rev Microbiol. 2011. PMID: 21639789 Review. - Integrated overview of stramenopile ecology, taxonomy, and heterotrophic origin.
Jirsová D, Wideman JG. Jirsová D, et al. ISME J. 2024 Jan 8;18(1):wrae150. doi: 10.1093/ismejo/wrae150. ISME J. 2024. PMID: 39077993 Free PMC article. Review.
Cited by
- Harmful Microalgae Exhibit Broad Environmental Adaptability in High-Salinity Area Across the Dafengjiang River Estuary.
Huang J, Zhao H, Wang W, Qin X, Wang P, Hou Q, Chen Q, Jiang G, Dong K, Jiang T, Pu Y, Li N. Huang J, et al. Ecol Evol. 2024 Oct 23;14(10):e70455. doi: 10.1002/ece3.70455. eCollection 2024 Oct. Ecol Evol. 2024. PMID: 39445184 Free PMC article. - Interaction between phytoplankton and heterotrophic bacteria in Arctic fjords during the glacial melting season as revealed by eDNA metabarcoding.
Han D, Park KT, Kim H, Kim TH, Jeong MK, Nam SI. Han D, et al. FEMS Microbiol Ecol. 2024 Apr 10;100(5):fiae059. doi: 10.1093/femsec/fiae059. FEMS Microbiol Ecol. 2024. PMID: 38621717 Free PMC article. - The RNA virosphere: How big and diverse is it?
Dominguez-Huerta G, Wainaina JM, Zayed AA, Culley AI, Kuhn JH, Sullivan MB. Dominguez-Huerta G, et al. Environ Microbiol. 2023 Jan;25(1):209-215. doi: 10.1111/1462-2920.16312. Epub 2022 Dec 28. Environ Microbiol. 2023. PMID: 36511833 Free PMC article. No abstract available. - A robust approach to estimate relative phytoplankton cell abundances from metagenomes.
Pierella Karlusich JJ, Pelletier E, Zinger L, Lombard F, Zingone A, Colin S, Gasol JM, Dorrell RG, Henry N, Scalco E, Acinas SG, Wincker P, de Vargas C, Bowler C. Pierella Karlusich JJ, et al. Mol Ecol Resour. 2023 Jan;23(1):16-40. doi: 10.1111/1755-0998.13592. Epub 2022 Feb 16. Mol Ecol Resour. 2023. PMID: 35108459 Free PMC article.
References
- Altschul SF, Gish W, Miller W, Myers EW, Lipman DJ. Basic local alignment search tool. J Mol Biol. 1990;215:403–410. - PubMed
- Baldauf SL. The deep roots of eukaryotes. Science. 2003;300:1703–1706. - PubMed
- Caron D, Countway P, Jones A, Kim D, Schnetzer A. Marine protistan diversity. Ann Rev Mar Sci. 2012;4:6.1–6.27. - PubMed
- Edgar RC. Search and clustering orders of magnitude faster than BLAST. Bioinformatics. 2010;26:2460–2461. - PubMed


