Endogenous protein S-Nitrosylation in E. coli: regulation by OxyR - PubMed (original) (raw)
Endogenous protein S-Nitrosylation in E. coli: regulation by OxyR
Divya Seth et al. Science. 2012.
Abstract
Endogenous S-nitrosylation of proteins, a principal mechanism of cellular signaling in eukaryotes, has not been observed in microbes. We report that protein S-nitrosylation is an obligate concomitant of anaerobic respiration on nitrate in Escherichia coli. Endogenous S-nitrosylation during anaerobic respiration is controlled by the transcription factor OxyR, previously thought to operate only under aerobic conditions. Deletion of OxyR resulted in large increases in protein S-nitrosylation, and S-nitrosylation of OxyR induced transcription from a regulon that is distinct from the regulon induced by OxyR oxidation. Furthermore, products unique to the anaerobic regulon protected against S-nitrosothiols, and anaerobic growth of E. coli lacking OxyR was impaired on nitrate. Thus, OxyR serves as a master regulator of S-nitrosylation, and alternative posttranslational modifications of OxyR control distinct transcriptional responses.
Figures
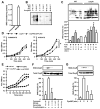
Figure 1. Accumulation of SNO-proteins and nitrosative stress in E. coli respiring anaerobically on nitrate
(A) Endogenous S-nitrosylation in E. coli growing anaerobically on nitrate. E. coli were grown in minimal medium containing either fumarate or nitrate (10 mM) and harvested during mid-log phase (absorbance at 600 nm of 0.4). The SNO content of lysates was determined by mercury-coupled photolysis-chemiluminescence (n=3, ± SEM). (B) SNO-proteins generated during anaerobic growth. E. coli were grown as in (A), and lysates were subjected to biotin-switch and Western blotting with NeutrAvidin-horseradish peroxidase. Ascorbate (±) and pre-ultraviolet photolysis (pre-phot.) controls were included. (C) Regulation by OxyR of protein S-nitrosylation and denitrosylation. WT and ΔoxyR E. coli were grown anaerobically as in (A). As indicated, cells growing on fumarate were treated with CysNO (200 μM) and SNO-proteins in lysates were visualized by biotin-switch as in (B). Results represent three to five separate experiments (± SEM).* P< 0.05 WT versus ΔoxyR. (D) Impaired growth of OxyR-null bacteria on nitrate. WT, ΔoxyR and ΔoxyR/OxyR-FLAG (ΔoxyR overexpressing FLAG-tagged OxyR) were grown as in (A) (n=5 at each time point; *P < 0.05). (E) Protection by OxyR against nitrosative stress. Growth of WT and of ΔoxyRE. coli following single addition of GSNO (125 μM)at time 0( n=3). UT, untreated. (F) S-nitrosylation of OxyR during anaerobic growth on nitrate. ΔoxyR /OxyR-FLAG E. coli were grown as in (A). SNO-OxyR in lysates was analyzed by SNO-RAC (n=4, ± SEM). *Differs from fumarate control by analysis of variance (ANOVA) with Dunnett’s test, P < 0.05. Control samples were generated by omission of ascorbate or by pre-photolysis. (G) Dynamic S-nitrosylation and denitrosylation of OxyR. _ΔoxyR/_OxyR-FLAG E. coli grown anaerobically on 10 mM fumarate as in (A) were treated with a single addition of CysNO (200 μM). Lysates were analyzed by SNO-RAC (n=4, ± SEM). *Differs from 0 min control by ANOVA with Dunnett’s test, P < 0.05.
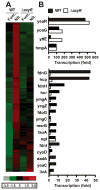
Figure 2. Microarray analysis of gene expression in E. coli growing anaerobically
(A) Expression of OxyR -regulated genes on nitrate versus fumarate. Genes in WT cells induced >2.0 -fold on nitrate (left panel); a large majority are OxyR-dependent. Genspring GX software (Agilent) was used to analyze microarray results, and genes were clustered by using dChip. (B) Validation by QPCR of the top 20 genes regulated anaerobically on nitrate in WT E. coli and the role of OxyR. Cells were grown anaerobically on nitrate or fumarate before QPCR. Fold expression of each gene on nitrate was calculated relative to expression on fumarate using the comparative Ct method. Expression in each sample was normalized to that of 16s rRNA(n=2).
Figure 3. Activation of hcp transcription by SNO-OxyR
(A) Increased hcp gene expression induced by SNOs. E. coli (WT and ΔoxyR) were grown aerobically or anaerobically to mid-log phase and treated as indicated for 5 min. Expression levels of hcp RNA were determined by QPCR (WT n=3 ± SEM; ΔoxyR_n=2). UT, untreated (B) In vitro transcription at hcp promoter by S-nitrosylated but not S-oxidized OxyR. Primer extension products of in vitro transcription reactions with S-nitrosylated and S-oxidized OxyR are shown. A plasmid containing the hcp gene [and the β-lactamase (bla) gene] was used as the template. DTT and ascorbate were used at 100 mM. Results are expressed as percent induction by SNO-OxyR, normalized with respect to bla control (n=3 separate SNO-OxyR preparations, ± SEM). Activation of katG transcription by the same preparation of OxyR-SOx is also shown (grouping of images from within the same gel is indicated by vertical dividing lines). BSA, bovine serum albumin. (C) Dependence of hcp expression during ARN on OxyR Cys199. Cys199 was identified as the sole site of S-nitrosylation in OxyR by mass spectrometry (see figs. S9 and S10, supplementary text). Δ_oxyR/OxyR-FLAG and Δ_oxyR_/C199S-OxyR-FLAG E. coli were grown anaerobically on nitrate or fumarate. Fold expression of hcp (OxyR-dependent) and of hmp (OxyR-independent) on fumarate or nitrate in OxyR-FLAG (WT) versus C199S-OxyR-FLAG cells was calculated using the comparative Ct method. Expression levels were normalized to 16s rRNA(n = 2 experiments). (D) Interaction of SNO-OxyR with hcp promoter and recruitment of RNA polymerase. _ΔoxyR/_OxyR-FLAG lysate was incubated with a biotin-labeled hcp promoter fragment in the presence of DTT or GSNO. Proteins bound to DNA were pulled down by streptavidin beads and visualized by Western blotting with antibodies to FLAG and to RNA polymerase β’. The results are representative of three experiments.
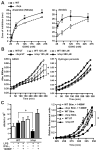
Figure 4. Protection against nitrosative stress by Hcp
(A) Hcp protects against growth inhibition by nitrosative stress. Sensitivity of WT and Δhcp cells to different concentrations of GSNO was assessed in zone-of-inhibition assays. Data represent diameter of zone of inhibition by GSNO under aerobic or anaerobic conditions (n=3 ± SEM; *P < 0.05, Student’s _t_ test). **(B) Sensitivity of _Δhcp_ mutant to nitrosative stress but not oxidative stress in vitro.** Growth of WT and _Δhcp E. coli_ was measured after treatment with increasing concentrations of GSNO or H2O2 (GSNO n=3, H2O2 n=5; * _P_< 0.01 ; WT versus Δ_hcp_ by two -way ANOVA). UT, untreated. **(C) Sensitivity of** _Δ_ **_hcp_ mutant to nitrosative stress _in vivo_**. WT or Δ_hcp E. coli_ were exposed for 30 min to cytokine-activated macrophages ± inducible NO synthase inhibitor 1400W. (Left) Internalized _E. coli_ were plated on LB agar and colonies were counted after overnight incubation (n=4 ± SEM; *_P_ < 0.01; WT versus Δ_hcp_, Student’s _t_ test). (Right) Growth of internalized _E. coli_ was also followed by an Alamar Blue fluorescence assay (n=3 ± SEM; *_P_ < 0.01; WT versus Δ_hcp_, two-way ANOVA). Increased sensitivity to macrophage-derived nitrosative stress in Δ_hcp_ cells was not evident after prolonged incubations (>1 hour; not shown). IFN-γ, interferon-γ.
Similar articles
- Anaerobic Transcription by OxyR: A Novel Paradigm for Nitrosative Stress.
Seth D, Hausladen A, Stamler JS. Seth D, et al. Antioxid Redox Signal. 2020 Apr 20;32(12):803-816. doi: 10.1089/ars.2019.7921. Epub 2019 Dec 3. Antioxid Redox Signal. 2020. PMID: 31691575 Free PMC article. Review. - S-nitrosylation signaling in Escherichia coli.
Gusarov I, Nudler E. Gusarov I, et al. Sci Signal. 2012 Jun 12;5(228):pe26. doi: 10.1126/scisignal.2003181. Sci Signal. 2012. PMID: 22692422 - A Multiplex Enzymatic Machinery for Cellular Protein S-nitrosylation.
Seth D, Hess DT, Hausladen A, Wang L, Wang YJ, Stamler JS. Seth D, et al. Mol Cell. 2018 Feb 1;69(3):451-464.e6. doi: 10.1016/j.molcel.2017.12.025. Epub 2018 Jan 18. Mol Cell. 2018. PMID: 29358078 Free PMC article. - Peroxynitrite toxicity in Escherichia coli K12 elicits expression of oxidative stress responses and protein nitration and nitrosylation.
McLean S, Bowman LA, Sanguinetti G, Read RC, Poole RK. McLean S, et al. J Biol Chem. 2010 Jul 2;285(27):20724-31. doi: 10.1074/jbc.M109.085506. Epub 2010 Apr 28. J Biol Chem. 2010. PMID: 20427277 Free PMC article. - Reactions of nitric oxide and oxygen with the regulator of fumarate and nitrate reduction, a global transcriptional regulator, during anaerobic growth of Escherichia coli.
Crack JC, Le Brun NE, Thomson AJ, Green J, Jervis AJ. Crack JC, et al. Methods Enzymol. 2008;437:191-209. doi: 10.1016/S0076-6879(07)37011-0. Methods Enzymol. 2008. PMID: 18433630 Review.
Cited by
- Protein Transnitrosylation Signaling Networks Contribute to Inflammaging and Neurodegenerative Disorders.
Nakamura T, Oh CK, Zhang X, Tannenbaum SR, Lipton SA. Nakamura T, et al. Antioxid Redox Signal. 2021 Sep 1;35(7):531-550. doi: 10.1089/ars.2021.0081. Epub 2021 Jun 21. Antioxid Redox Signal. 2021. PMID: 33957758 Free PMC article. Review. - Sulfur Denitrosylation by an Engineered Trx-like DsbG Enzyme Identifies Nucleophilic Cysteine Hydrogen Bonds as Key Functional Determinant.
Lafaye C, Van Molle I, Tamu Dufe V, Wahni K, Boudier A, Leroy P, Collet JF, Messens J. Lafaye C, et al. J Biol Chem. 2016 Jul 15;291(29):15020-8. doi: 10.1074/jbc.M116.729426. Epub 2016 May 18. J Biol Chem. 2016. PMID: 27226614 Free PMC article. - S-Nitrosylation Induces Structural and Dynamical Changes in a Rhodanese Family Protein.
Eichmann C, Tzitzilonis C, Nakamura T, Kwiatkowski W, Maslennikov I, Choe S, Lipton SA, Riek R. Eichmann C, et al. J Mol Biol. 2016 Sep 25;428(19):3737-51. doi: 10.1016/j.jmb.2016.07.010. Epub 2016 Jul 27. J Mol Biol. 2016. PMID: 27473602 Free PMC article. - NO Network for Plant-Microbe Communication Underground: A Review.
Pande A, Mun BG, Lee DS, Khan M, Lee GM, Hussain A, Yun BW. Pande A, et al. Front Plant Sci. 2021 Mar 17;12:658679. doi: 10.3389/fpls.2021.658679. eCollection 2021. Front Plant Sci. 2021. PMID: 33815456 Free PMC article. Review. - S-nitrosylation: integrator of cardiovascular performance and oxygen delivery.
Haldar SM, Stamler JS. Haldar SM, et al. J Clin Invest. 2013 Jan;123(1):101-10. doi: 10.1172/JCI62854. Epub 2013 Jan 2. J Clin Invest. 2013. PMID: 23281416 Free PMC article. Review.
References
- Hess DT, Matsumoto A, Kim SO, Marshall HE, Stamler JS. Nat Rev Mol Cell Biol. 2005;6:150. - PubMed
- Benhar M, Forrester MT, Stamler JS. Nat Rev Mol Cell Biol. 2009;10:721. - PubMed
- MacMicking J, Xie QW, Nathan C. Annu Rev Immunol. 1997;15:323. - PubMed
Publication types
MeSH terms
Substances
Grants and funding
- R01-HL059130/HL/NHLBI NIH HHS/United States
- R01 HL096673/HL/NHLBI NIH HHS/United States
- R01 HL095463/HL/NHLBI NIH HHS/United States
- R01 HL059130/HL/NHLBI NIH HHS/United States
- R01-HL096673/HL/NHLBI NIH HHS/United States
- R01-HL095463/HL/NHLBI NIH HHS/United States
LinkOut - more resources
Full Text Sources
Other Literature Sources
Molecular Biology Databases


