Proteolytic activation of proapoptotic kinase protein kinase Cδ by tumor necrosis factor α death receptor signaling in dopaminergic neurons during neuroinflammation - PubMed (original) (raw)
Proteolytic activation of proapoptotic kinase protein kinase Cδ by tumor necrosis factor α death receptor signaling in dopaminergic neurons during neuroinflammation
Richard Gordon et al. J Neuroinflammation. 2012.
Abstract
Background: The mechanisms of progressive dopaminergic neuronal loss in Parkinson's disease (PD) remain poorly understood, largely due to the complex etiology and multifactorial nature of disease pathogenesis. Several lines of evidence from human studies and experimental models over the last decade have identified neuroinflammation as a potential pathophysiological mechanism contributing to disease progression. Tumor necrosis factor α (TNF) has recently emerged as the primary neuroinflammatory mediator that can elicit dopaminergic cell death in PD. However, the signaling pathways by which TNF mediates dopaminergic cell death have not been completely elucidated.
Methods: In this study we used a dopaminergic neuronal cell model and recombinant TNF to characterize intracellular signaling pathways activated during TNF-induced dopaminergic neurotoxicity. Etanercept and neutralizing antibodies to tumor necrosis factor receptor 1 (TNFR1) were used to block TNF signaling. We confirmed the results from our mechanistic studies in primary embryonic mesencephalic cultures and in vivo using the stereotaxic lipopolysaccharide (LPS) model of nigral dopaminergic degeneration.
Results: TNF signaling in dopaminergic neuronal cells triggered the activation of protein kinase Cδ (PKCδ), an isoform of the novel PKC family, by caspase-3 and caspase-8 dependent proteolytic cleavage. Both TNFR1 neutralizing antibodies and the soluble TNF receptor Etanercept blocked TNF-induced PKCδ proteolytic activation. Proteolytic activation of PKCδ was accompanied by translocation of the kinase to the nucleus. Notably, inhibition of PKCδ signaling by small interfering (si)RNA or overexpression of a PKCδ cleavage-resistant mutant protected against TNF-induced dopaminergic neuronal cell death. Further, primary dopaminergic neurons obtained from PKCδ knockout (-/-) mice were resistant to TNF toxicity. The proteolytic activation of PKCδ in the mouse substantia nigra in the neuroinflammatory LPS model was also observed.
Conclusions: Collectively, these results identify proteolytic activation of PKCδ proapoptotic signaling as a key downstream effector of dopaminergic cell death induced by TNF. These findings also provide a rationale for therapeutically targeting PKCδ to mitigate progressive dopaminergic degeneration resulting from chronic neuroinflammatory processes.
Figures
Figure 1
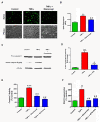
Tumor necrosis factor (TNF)-induced neurotoxicity and caspase activation in N27 dopaminergic neuronal cells. (A) Visualization of TNF toxicity by Sytox fluorescence cytotoxicity assay. N27 dopaminergic cells treated with TNF (30 ng/ml), or pretreated with etanercept (5 μg/ml) for 30 minutes and were processed for Sytox green imaging at 16 h. Increased green fluorescence is evident with TNF treatment, indicating significant neurotoxicity which was also evident in the phase contrast images. (B) Sytox fluorescence was quantified by measuring the fluorescence intensity as relative fluorescence units (RFU) using a plate reader. (C) Activation of caspase-8 by TNF treatment. Lysates from N27 cells treated with TNF (30 ng/ml) for 3 h were probed using a rabbit polyclonal antibody to caspase-8 that detects the procaspase and the active cleaved form. TNF induced a significant increase in the active caspase-8 (p20) fragment, which was blocked by pretreatment with etanercept (5 μg/ml). (D) Band intensities for cleaved caspase-8 from three blots were quantified using densitometric analysis and normalized to β-actin. (E) TNF induced activation of caspase-3. Enzymatic assays for caspase-3 activity in lysates from N27 cells treated with TNF (30 ng/ml) for 6 h or pretreated with either etanercept (5 μg/ml) or the caspase-8 inhibitor IETD-fmk (25 μM) for 30 minutes. Raw values were normalized using protein concentrations and expressed as percent control. TNF treatment induced significant activation of caspase-3, which was blocked by etanercept and the caspase-8 inhibitor IETD-fmk. (F) TNF-induced DNA fragmentation. N27 cells were treated with TNF (30 ng/ml) for 16 h or pretreated for 30 minutes with either etanercept (5 μg/ml) or the caspase-8 peptide inhibitor IETD-fmk (25 μM), and processed for the DNA fragmentation assay. Raw values were normalized using protein concentration and expressed as percent control. TNF treatment significantly increased DNA fragmentation, which was attenuated by etanercept or caspase-8 inhibition. Data represent the group mean ± SEM; n = 6 to 8 per group and experiments were repeated three times. ** (P <0.01) indicates significant differences compared to control cells; ## (P <0.01) and # (P <0.05) indicates significant differences compared to TNF-treated cells.
Figure 2
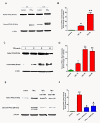
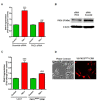
Tumor necrosis factor (TNF) induced proteolytic cleavage of protein kinase Cδ (PKCδ) in dopaminergic N27 cells. (A) Time-dependent PKCδ proteolytic activation. N27 dopaminergic cells were treated with recombinant TNF (30 ng/ml) for 3 h and 6 h and lysates were probed by Western blotting with an antibody to the C-terminus that detects both the native protein (78 kDa) and the proteolytically cleaved catalytic fragment (38 kDa). TNF treatment caused a time-dependent increase in PKCδ cleavage, which peaked at 6 h. (B) Band intensities for cleaved PKCδ from three blots quantified using densitometric analysis and normalized to β-actin. (C) Dose-dependent proteolytic activation of PKCδ by TNF treatment. N27 cells were treated with increasing doses of TNF (0 to 60 ng/ml) for 6 h and lysates were probed for PKCδ by Western blotting. TNF induced a dose dependent increase in PKCδ cleavage, starting at 10 ng/ml. (D) Band intensities for cleaved PKCδ from three blots were quantified using densitometric analysis and normalized to β-actin. (E) Caspase-3 and caspase-8 dependent proteolytic cleavage of PKCδ. N27 cells were treated with 30 ng/ml of TNF alone for 6 h or in the presence of peptide inhibitors (25 μM) of caspase-8 (Ac-IETD-fmk) and caspase-3 (Ac-DEVD-fmk). Lysates were probed for PKCδ proteolytic cleavage by Western blotting. Proteolytic activation of PKCδ by TNF treatment was reduced by inhibition of caspase-3 and caspase-8. (F) Band intensities for cleaved PKCδ from three blots were quantified using densitometric analysis and normalized to β-actin. Data is expressed as a fold change over control. * (P <0.05) and ** indicate significant differences compared to control cells; # (P <0.05) indicates significant differences compared to TNF-treated cells.
Figure 3
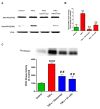
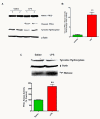
Proteolytic cleavage and activation of protein kinase Cδ (PKCδ) downstream of tumor necrosis factor receptor 1 (TNFR1) in N27 dopaminergic cells. (A) TNFR1-dependent proteolytic activation of PKCδ. N27 cells were treated with tumor necrosis factor (TNF) (30 ng/ml) for 6 h or pretreated with either a TNFR1 neutralizing antibody (TNFR1-nAb, 20 μg/ml) or etanercept (5 μg/ml) for 30 minutes and lysates were probed for PKCδ proteolytic cleavage by Western blotting. TNF induced strong proteolytic cleavage of PKCδ that could be blocked by neutralizing TNFR1 receptor signaling. (B) Band intensities for cleaved PKCδ were quantified using densitometric analysis and normalized to β-actin levels. (C) Immunoprecipitation (IP)-kinase assay for PKCδ activation. IP-kinase assays were performed on the same cell lysates used for Western blots. PKCδ was immunoprecipitated from 500 μg of total protein from each sample and used for the in vitro kinase activity assay with a histone substrate and radiolabeled [γ-32P] ATP. PKCδ activity was quantified using densitometric analysis of the 32P-histone band intensity and expressed as percent control. The proteolytic cleavage of PKCδ induced by TNF treatment was accompanied by a concomitant increase in kinase activity and was dependent on signaling through the TNFR1 receptor. A representative kinase assay gel is shown. Data represent the group mean ± SEM of densitometric values obtained from three independent experiments. *** (P <0.001) denotes significant differences compared to control cells and ## (P <0.01) denotes significant differences compared to TNF-treated cells.
Figure 4
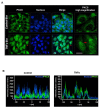
Protein kinase Cδ (PKCδ) translocates to the nucleus during tumor necrosis factor (TNF) treatment. (A) Confocal imaging of PKCδ localization. N27 cells were treated with TNF for 6 h and processed for immunocytochemistry using a rabbit polyclonal antibody that recognizes both the native and cleaved form of PKCδ. An Alexa-488 dye-tagged secondary antibody was used to visualize PKCδ (green), and the nucleus was stained using the TOPRO-3 dye (blue). In untreated controls (top panel), PKCδ was distinctly localized to the cytosol. In TNF-treated cells (lower panel), a distinct localization of PKCδ to the nucleus and the perinuclear region is seen. Scale bars are 20 microns. High magnification images (right panel) of PKCδ immunofluorescence staining in N27 cells showing PKCδ accumulation within the nucleus and at distinct spatial locations at the perinuclear region following TNF treatment (red arrows). Representative images are shown; experiments were repeated three times using different secondary antibodies for validation. (B) Fluorescence spatial intensity plots along a representative XY plane for PKCδ localization (green channel) and the nucleus (blue channel) were obtained using the Nikon EZC1 image analysis software. Control images show a distinct spatial localization of green and blue fluorescence intensities in the XY plane indicative of cytosolic PKCδ localization. In TNF-treated cells a spatial colocalization of green and blue fluorescence signals is evident indicating nuclear translocation of PKCδ.
Figure 5
Knockdown of protein kinase Cδ (PKCδ) with siRNA and overexpression of the PKCδ proteolytic cleavage-resistant mutant (PKCδ D327A -CRM) protects against tumor necrosis factor (TNF) toxicity. (A) DNA fragmentation assay in siRNA transfected cells. N27 cells transfected with either siRNA to PKCδ or scrambled control siRNA were treated with TNF for 16 h and processed for the DNA fragmentation ELISA. Raw values were normalized to protein concentrations and expressed as the fold change over the respective controls. TNF-induced DNA fragmentation was significantly reduced in PKCδ siRNA transfected cells. (B) Suppression of the PKCδ protein levels by siRNA was confirmed by Western blotting. (C) DNA fragmentation assay in N27 cells overexpressing the cleavage-resistant PKCδ mutant protein (PKCδD327A-CRM). N27 cells stably expressing the cleavage-resistant PKCδ mutant or the β-galactosidase (LacZ) control gene were treated with TNF for 16 h and processed for the DNA fragmentation assay. Expression of the mutant PKCδ protein was confirmed by imaging the V5 tag by immunocytochemistry. (D) DNA fragmentation induced by TNF was attenuated in N27 cells expressing the caspase-3 cleavage-resistant mutant protein, indicating the proteolytic cleavage is a necessary event for TNF toxicity in these cells. Data represent the group mean ± SEM, n = 6 to 8 per group and experiments were repeated three times. *** (P <0.001) indicates significant differences with TNF treatment compared to controls in scramble siRNA and LacZ expressing cells; ## (P <0.01) indicates significant differences between the two TNF treatment groups.
Figure 6
Primary dopaminergic neurons in EVM cultures from protein kinase Cδ knockout (PKCδ −/−) mice are protected against tumor necrosis factor (TNF) toxicity. Primary mouse EVM neuronal cultures were treated with recombinant TNF (30 ng/ml) in supplement-free neurobasal medium. TNF was re-added 24 h later for a total treatment time of 48 h. PKCδ wild-type (PKCδ +/+) and knockout (PKCδ −/−) EVM cultures were treated in parallel. (A) Immunocytochemistry for tyrosine hydroxylase (TH)-positive neurons. Dopaminergic neurons were identified by TH staining (green) and microtubule-associated protein 2 (MAP-2) (red) was used as a pan-neuronal marker. Images were acquired at 20 × magnification. Representative fields are shown for each treatment. In the TNF-treated group, extensive loss of neurites and degeneration of dopaminergic neurons is evident in cultures from PKCδ wild-type (+/+) mice (top panel) whereas cultures from PKCδ knockout (−/−) mice had visible branched neurites, more numerous cell bodies and were resistant to degeneration induced by TNF (lower panel). (B,C) TH-positive neuron counts and dopamine uptake assays. (B) Dopaminergic neurons were identified by tyrosine hydroxylase labeling, and the number of TH-positive neurons from 12 random fields per well were counted at 20 × magnification for each treatment group. (C) The uptake of tritiated [3 H] dopamine was determined in cultures from PKCδ wild-type (WT) and knockout mice. The values for non-specific uptake of dopamine obtained in the presence of mazindol were subtracted as background and the data expressed as percent control. Data represent the group mean ± SEM, n = 4 to 6 per group and experiments were repeated three times. ***P <0.001 indicates a significant difference between control and TNF-treated groups in PKCδ wild type cultures. # (P <0.05) and ## (P <0.01) indicate a significant difference between TNF-treated groups in PKCδ wild-type and PKCδ knockout (−/−) cultures.
Figure 7
Proteolytic activation of protein kinase Cδ (PKCδ) in the mouse substantia nigra during LPS-induced dopaminergic degeneration. C57BL/6 mice were stereotaxically injected with a single dose of lipopolysaccharide (LPS) (5 μg) or saline in the substantia nigra (SN) to elicit dopaminergic degeneration. Mice were sacrificed after 14 days. (A) Proteolytic cleavage of PKCδ in mouse substantia nigra tissue. Western blots were performed on nigral tissue lysates obtained from mice stereotaxically injected with either LPS or saline. Strong proteolytic cleavage of PKCδ is seen in LPS-injected mice and was essentially absent in the saline-injected animals. Blots were also probed for tyrosine hydroxylase and β-actin to confirm accurate dissection of the nigral tissue and equal protein loading respectively. (B) PKCδ cleaved band intensity was quantified by densitometric analysis after normalization to β-actin (n = 4 to 6 mice per group). (C) PKCδ kinase activity in mouse substantia nigra tissue. PKCδ IP-kinase assays were performed on nigral tissue lysates. Kinase activity was quantified by densitometric analysis of the 32P-histone bands (n = 4 mice per group). A representative kinase gel is shown. Western blots of tyrosine hydroxylase and β-actin were performed on the same lysates to verify accurate dissection of the nigral tissue. Data represent the group mean ± SEM. ** (P <0.01) indicates a significant difference between saline and LPS-injected mice.
Figure 8
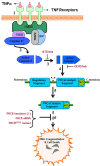
Schematic of protein kinase Cδ (PKCδ) activation by proteolytic cleavage downstream of tumor necrosis factor (TNF) signaling in dopaminergic neurons. (1) Sustained TNF signaling leads to caspase-8 activation, presumably by autoproteolytic cleavage at the receptor complex (2). Active caspase-8 leads to downstream activation of caspase-3, which can be blocked by the caspase-8 inhibitor IETD-fmk (3). Caspase-3 activates PKCδ by proteolytic cleavage (4) at the hinge region (shown in red), releasing the catalytic fragment and causing constitutive activation of the kinase (5). The constitutively active PKCδ catalytic fragment mediates proapoptotic signaling by phosphorylation of its downstream substrates, resulting in DNA fragmentation and dopaminergic cell death (6). Blocking the PKCδ signaling pathway using siRNA, targeted gene knockout or a caspase-3 cleavage-resistant mutant can protect against dopaminergic cell death induced by TNF toxicity.
Similar articles
- Protein kinase Cδ upregulation in microglia drives neuroinflammatory responses and dopaminergic neurodegeneration in experimental models of Parkinson's disease.
Gordon R, Singh N, Lawana V, Ghosh A, Harischandra DS, Jin H, Hogan C, Sarkar S, Rokad D, Panicker N, Anantharam V, Kanthasamy AG, Kanthasamy A. Gordon R, et al. Neurobiol Dis. 2016 Sep;93:96-114. doi: 10.1016/j.nbd.2016.04.008. Epub 2016 May 2. Neurobiol Dis. 2016. PMID: 27151770 Free PMC article. - Dopaminergic neurotoxicant 6-OHDA induces oxidative damage through proteolytic activation of PKCδ in cell culture and animal models of Parkinson's disease.
Latchoumycandane C, Anantharam V, Jin H, Kanthasamy A, Kanthasamy A. Latchoumycandane C, et al. Toxicol Appl Pharmacol. 2011 Nov 1;256(3):314-23. doi: 10.1016/j.taap.2011.07.021. Epub 2011 Aug 6. Toxicol Appl Pharmacol. 2011. PMID: 21846476 Free PMC article. - Environmental neurotoxic pesticide dieldrin activates a non receptor tyrosine kinase to promote PKCδ-mediated dopaminergic apoptosis in a dopaminergic neuronal cell model.
Saminathan H, Asaithambi A, Anantharam V, Kanthasamy AG, Kanthasamy A. Saminathan H, et al. Neurotoxicology. 2011 Oct;32(5):567-77. doi: 10.1016/j.neuro.2011.06.009. Epub 2011 Jul 23. Neurotoxicology. 2011. PMID: 21801747 Free PMC article. - Novel cell death signaling pathways in neurotoxicity models of dopaminergic degeneration: relevance to oxidative stress and neuroinflammation in Parkinson's disease.
Kanthasamy A, Jin H, Mehrotra S, Mishra R, Kanthasamy A, Rana A. Kanthasamy A, et al. Neurotoxicology. 2010 Sep;31(5):555-61. doi: 10.1016/j.neuro.2009.12.003. Epub 2009 Dec 11. Neurotoxicology. 2010. PMID: 20005250 Free PMC article. Review. - Role of protein kinase Cδ in dopaminergic neurotoxic events.
Shin EJ, Hwang YG, Sharma N, Tran HQ, Dang DK, Jang CG, Jeong JH, Nah SY, Nabeshima T, Kim HC. Shin EJ, et al. Food Chem Toxicol. 2018 Nov;121:254-261. doi: 10.1016/j.fct.2018.09.005. Epub 2018 Sep 6. Food Chem Toxicol. 2018. PMID: 30195712 Review.
Cited by
- Tumor Necrosis Factor-Like Weak Inducer of Apoptosis (TWEAK) Enhances Activation of STAT3/NLRC4 Inflammasome Signaling Axis through PKCδ in Astrocytes: Implications for Parkinson's Disease.
Samidurai M, Tarale P, Janarthanam C, Estrada CG, Gordon R, Zenitsky G, Jin H, Anantharam V, Kanthasamy AG, Kanthasamy A. Samidurai M, et al. Cells. 2020 Aug 4;9(8):1831. doi: 10.3390/cells9081831. Cells. 2020. PMID: 32759670 Free PMC article. - Protein kinase C-delta inhibition protects blood-brain barrier from sepsis-induced vascular damage.
Tang Y, Soroush F, Sun S, Liverani E, Langston JC, Yang Q, Kilpatrick LE, Kiani MF. Tang Y, et al. J Neuroinflammation. 2018 Nov 6;15(1):309. doi: 10.1186/s12974-018-1342-y. J Neuroinflammation. 2018. PMID: 30400800 Free PMC article. - Pharmacological Inhibition of PTEN Rescues Dopaminergic Neurons by Attenuating Apoptotic and Neuroinflammatory Signaling Events.
Johnson AM, Jose S, Palakkott AR, Khan FB, Jayabalan N, Kizhakkayil J, AlNaqbi SAA, Scott MG, Ayoub MA, Gordon R, Saminathan H. Johnson AM, et al. J Neuroimmune Pharmacol. 2023 Sep;18(3):462-475. doi: 10.1007/s11481-023-10077-8. Epub 2023 Aug 17. J Neuroimmune Pharmacol. 2023. PMID: 37589761 - T-cell-mediated regulation of neuroinflammation involved in neurodegenerative diseases.
González H, Pacheco R. González H, et al. J Neuroinflammation. 2014 Dec 2;11:201. doi: 10.1186/s12974-014-0201-8. J Neuroinflammation. 2014. PMID: 25441979 Free PMC article. Review. - Immunotherapies for Neurodegenerative Diseases.
Mortada I, Farah R, Nabha S, Ojcius DM, Fares Y, Almawi WY, Sadier NS. Mortada I, et al. Front Neurol. 2021 Jun 7;12:654739. doi: 10.3389/fneur.2021.654739. eCollection 2021. Front Neurol. 2021. PMID: 34163421 Free PMC article. Review.
References
Publication types
MeSH terms
Substances
Grants and funding
- R01 NS074443/NS/NINDS NIH HHS/United States
- NS74443/NS/NINDS NIH HHS/United States
- NS 65167/NS/NINDS NIH HHS/United States
- NS078247/NS/NINDS NIH HHS/United States
- R01 ES010586/ES/NIEHS NIH HHS/United States
LinkOut - more resources
Full Text Sources
Medical
Molecular Biology Databases
Research Materials
