Growth inhibition by miR-519 via multiple p21-inducing pathways - PubMed (original) (raw)
. 2012 Jul;32(13):2530-48.
doi: 10.1128/MCB.00510-12. Epub 2012 Apr 30.
Subramanya Srikantan, Kumiko Tominaga, Min-Ju Kang, Yael Yaniv, Jennifer L Martindale, Xiaoling Yang, Sung-Soo Park, Kevin G Becker, Murugan Subramanian, Stuart Maudsley, Ashish Lal, Myriam Gorospe
Affiliations
- PMID: 22547681
- PMCID: PMC3434494
- DOI: 10.1128/MCB.00510-12
Growth inhibition by miR-519 via multiple p21-inducing pathways
Kotb Abdelmohsen et al. Mol Cell Biol. 2012 Jul.
Abstract
The microRNA miR-519 robustly inhibits cell proliferation, in turn triggering senescence and decreasing tumor growth. However, the molecular mediators of miR-519-elicited growth inhibition are unknown. Here, we systematically investigated the influence of miR-519 on gene expression profiles leading to growth cessation in HeLa human cervical carcinoma cells. By analyzing miR-519-triggered changes in protein and mRNA expression patterns and by identifying mRNAs associated with biotinylated miR-519, we uncovered two prominent subsets of miR-519-regulated mRNAs. One subset of miR-519 target mRNAs encoded DNA maintenance proteins (including DUT1, EXO1, RPA2, and POLE4); miR-519 repressed their expression and increased DNA damage, in turn raising the levels of the cyclin-dependent kinase (cdk) inhibitor p21. The other subset of miR-519 target mRNAs encoded proteins that control intracellular calcium levels (notably, ATP2C1 and ORAI1); their downregulation by miR-519 aberrantly elevated levels of cytosolic [Ca(2+)] storage in HeLa cells, similarly increasing p21 levels in a manner dependent on the Ca(2+)-activated kinases CaMKII and GSK3β. The rises in levels of DNA damage, the Ca(2+) concentration, and p21 levels stimulated an autophagic phenotype in HeLa and other human carcinoma cell lines. As a consequence, ATP levels increased, and the level of activity of the AMP-activated protein kinase (AMPK) declined, further contributing to the elevation in the abundance of p21. Our results indicate that miR-519 promotes DNA damage, alters Ca(2+) homeostasis, and enhances energy production; together, these processes elevate the expression level of p21, promoting growth inhibition and cell survival.
Figures
Fig 1
Analysis of miR-519-triggered growth arrest. (A) Forty-eight hours after the transfection of HeLa cells with either Ctrl siRNA or miR-519, cell numbers and cell viability were determined by direct cell counts and by analyzing trypan blue-positive cells. The graph represents the means and standard deviations (SD) of data from 3 independent experiments. (B) Forty-eight hours after the transfection of A549 (p53-proficient) and H1299 (p53-deficient) human lung carcinoma cells (top) and HCT116 wt and HCT116 p53−/− human colon carcinoma cells (bottom) with either Ctrl siRNA or miR-519, cell numbers were determined by direct cell counting. The graph represents the means and SD of data from 3 independent experiments. (C) Schematic of efforts undertaken to investigate miR-519-regulated gene expression, including an analysis of proteins (i) and mRNAs (iii) showing altered abundances as a function of miR-519 levels and the identification of putative mRNA targets by using biotinylated miR-519 (ii).
Fig 2
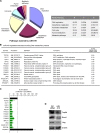
miR-519 inhibits DNA repair pathways. (A) Pathways of proteins that were downregulated after miR-519 transfection. Forty-eight hours after the transfection of HeLa cells with either Ctrl siRNA or miR-519, SILAC followed by KEGG proteomic analysis (see Materials and Methods) was performed to identify the families of proteins collectively influenced by miR-519. R, numerical degree of set enrichment of subsets of proteins; P, probability that the enrichment in the specific KEGG pathway would not occur by chance; H, hybrid score obtained by multiplying the negative log10(P) by R. (B) Forty-eight hours after the transfection of HeLa cells with Ctrl siRNA or miR-519, total RNA was extracted and used for microarray hybridization. Several mRNAs encoding DNA metabolism/repair whose steady-state abundances were reduced in miR-519-expressing cells are listed (“Z-ratio Steady-state mRNA levels” column). Array data were compiled from data from 3 independent experiments. (C and D) Validation of microarray-identified changes in steady-state mRNA levels after the expression of miR-519. Forty-eight hours after Ctrl siRNA or miR-519 transfection, total RNA was isolated and analyzed by RT-qPCR using mRNA-specific primer pairs (C), and the levels of several encoded proteins were assessed by Western blot analysis (D). Data in panel C represent the means and SD of data from 3 independent experiments. GAPDH, glyceraldehyde-3-phosphate dehydrogenase.
Fig 3
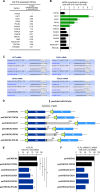
miR-519 induces DNA damage. (A) Forty-eight hours after the transfection of HeLa cells with either biotinylated Ctrl-miR (biot-Ctrl-miR) or biot-miR-519, mRNAs bound to each biotinylated transcript were isolated by using streptavidin beads (see Materials and Methods) and identified by microarray hybridization (“Z-ratio mRNA enriched in biot-miR-519” column). Array data were compiled from data from 3 independent experiments. (B) The validation of microarray-identified mRNAs associated with biot-miR-519 was performed by RT-qPCR using mRNA-specific primer pairs. (C) TargetScan prediction of the complementarity between miR-519 and the four target mRNAs shown in Fig. 2 (DUT mRNA, EXO1 mRNA, RPA2 mRNA, and POLE4 mRNA). (D and E) Schematic of reporter constructs that were prepared in order to test if miR-519 influenced the expressions of TOP2A, DUT1, EXO1, RPA2, and POLE4 mRNAs through their respective 3′UTRs. (D) Each 3′UTR (gray rectangles, with predicted miR-519 sites indicated by a black bar) was amplified by PCR and cloned into plasmid psiCHECK2, as shown. Twenty-four hours after the transfection of HeLa cells with either Ctrl siRNA or miR-519, each reporter plasmid was transfected, and the ratio of Renilla luciferase (RL) activity to the activity of the internal control firefly luciferase (FL) was calculated 24 h after that. (E) The relative RL/FL ratio of miR-519-transfected cells versus the RL/FL of Ctrl siRNA-transfected cells is indicated. (F) RL mRNA and FL mRNA levels for each reporter plasmid were calculated by RT-qPCR analysis. The relative RL mRNA/FL mRNA ratio for miR-519-transfected cells versus the RL mRNA/FL mRNA ratio for Ctrl siRNA-transfected cells is indicated. Data in panels B and E represent the means and SD of data from 3 independent experiments. *, P < 0.05. Data in panel F are the averages of data from two experiments showing comparable results.
Fig 4
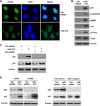
(A) Immunofluorescence micrographs depicting γ-H2AX foci, indicative of DNA damage, 48 h after the transfection of HeLa cells with Ctrl siRNA or miR-519. DAPI, 4′,6-diamidino-2-phenylindole. (B) Western blot analysis of proteins or phosphoproteins implicated in the response to DNA damage. (C) Forty-eight hours after the transfection of HeLa cells with the small RNAs indicated, the levels of p53 and p21 were assessed by Western blot analysis. (D) Forty-eight hours after the transfection of A549 and H1299 (left) or HCT116 wt and HCT116 p53−/− (right) cells with the small RNAs indicated, the levels of p53 and p21 were assessed by Western blot analysis. Data are representative of data from three independent experiments.
Fig 5
miR-519 upregulates pathways affecting Ca2+ homeostasis. (A) Pathways of proteins that were upregulated after miR-519 transfection. Forty-eight hours after the transfection of HeLa cells with either Ctrl siRNA or miR-519, SILAC followed by KEGG proteomic analysis (see Materials and Methods) was performed to identify the families of proteins collectively influenced by miR-519, as explained in the legend of Fig. 2A. ECM, extracellular matrix. (B and C) Among the mRNAs showing differential abundances after the expression of miR-519 (as identified in Fig. 2B), several encoded proteins were implicated in the maintenance of intracellular calcium (B); the steady-state levels of these mRNAs were individually validated by using RT-qPCR and specific primer pairs (C), as explained in the legend of Fig. 2C. Green bars indicate miR-519 target transcripts (ATP2C1 and ORAI1 mRNAs) whose steady-state abundances were particularly low after the expression of miR-519.
Fig 6
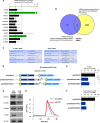
miR-519 represses Ca2+ transport proteins and delays cytoplasmic Ca2+ clearance. (A) Forty-eight hours after Ctrl siRNA or miR-519 transfection, the enrichment of mRNAs identified in Fig. 5A in biotin-miR-519 pulldown materials was individually validated by using RT-qPCR and specific primer pairs, as explained in the legend of Fig. 3A. The miR-519 target transcript, ATP2C1 and ORAI1 mRNAs (green) showed low steady-state abundances after the expression of miR-519 and were highly enriched in the biot-miR-519 pulldown. (B) Venn diagram illustrating the overlap between the mRNAs encoding calcium metabolism-related proteins bearing 3′UTR miR-519 sites and mRNAs showing reduced abundances after the overexpression of miR-519 (see Table S2 in the supplemental material). The two transcripts present in both groups were ATP2C1 and ORAI1 mRNAs. (C) TargetScan prediction of the complementarity of miR-519 with ORAI1 mRNA and ATP2C1 mRNA. (D) Schematic of reporter constructs that were engineered in order to test whether miR-519 influenced the expression of ATP2C1 or ORAI1 through their respective 3′UTRs. (E) Twenty-fours after the transfection of HeLa cells with either Ctrl siRNA or miR-519, each reporter was transfected, and the influence of miR-519 on their expressions was calculated 24 h after that, as explained in the legend of Fig. 3E. (F) RL mRNA and FL mRNA levels for each reporter plasmid were calculated by RT-qPCR analysis. The relative RL mRNA/FL mRNA ratio for miR-519-transfected cells versus the RL mRNA/FL mRNA ratio for Ctrl siRNA-transfected cells is indicated. (G) The expression of the Ca2+ transport proteins shown was assessed by Western blot analysis 48 h after transfection with Ctrl siRNA or miR-519. (H) Forty-eight hours after the transfection of HeLa cells with Ctrl siRNA or miR-519, cells were loaded with 20 μM Fluo-4 AM. Following stimulation with histamine (100 μM), confocal images were obtained every 20 s, quantified, and plotted (see Materials and Methods). Data in panels B and E represent the means and SD of data from 3 independent experiments. *, P < 0.05. Data in panel F are the averages of data from two experiments showing comparable results.
Fig 7
miR-519 represses levels of Ca2+ transport proteins. Forty-eight hours after the individual silencing of ATP2C1, ATP2B1, ATP2B4, or ORAI1 (A), the levels of p21 were assessed by Western blot analysis (B). The data are representative of data from at least 3 independent experiments.
Fig 8
Blocking of Ca2+ signaling inhibits miR-519-upregulated p21 but not miR-519-triggered DNA damage. (A) Western blot analysis of phosphorylated CaMKII (p-CaMKII) and total CaMKII 48 h after transfection of HeLa cells with Ctrl siRNA or miR-519 in the presence of KN-93 (6 μM). (B) The levels of phosphorylated GSK3β (p-GSK3β) at residue Tyr-216 (an inhibitory modification) were assessed by Western blot analysis 48 h after the transfection of HeLa cells with the small RNAs indicated, in the presence of dimethyl sulfoxide (DMSO), KN-93, EGTA, or I3MO (10 μM). (C and D) Forty-eight hours after the transfection of HeLa cells with Ctrl siRNA or miR-519 in the presence of either DMSO, KN-93, I3MO, 3-MA, or EGTA, the levels of p53, p21, and β-actin were assessed by Western blot analysis (C), and DNA damage was assessed by the visualization of γ-H2AX distribution patterns (D), as described in the legend of Fig. 3F. Data are representative of data from three independent experiments.
Fig 9
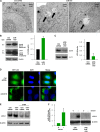
miR-519 triggers the formation of autophagic vesicles. (A) Forty-eight hours after the transfection of HeLa cells with either Ctrl siRNA or miR-519, electron microscopy was used to visualize the cytoplasm of HeLa cells. Arrows indicate autophagic vacuoles. (B) Western blot analysis of the autophagy marker LC3 in HeLa cells. Although two bands are seen after a long exposure of the blot, a strong ∼16-kDa LC3-II band and a faint ∼18-kDa LC3-I band, the predominant LC3-II band was visualized as a marker of autophagy throughout the study. The graph shows the quantification of the LC3-II intensity. (C) HeLa cells were transfected with a plasmid that expresses GFP-LC3, a fluorescent fusion protein that is recruited to autophagosomes, and with either Ctrl siRNA or miR-519. Forty-eight hours later, GFP-LC3 signals were visualized by fluorescence microscopy. DNA was stained with DAPI in order to visualize nuclei. (D) Western blot analysis (left) and quantification (right) of the levels of LC3-II in HeLa cells, as assessed by Western blot analysis 48 h after transfection with antisense miR-519 [(AS)miR-519] RNA. (E) HeLa cells were transfected with either Ctrl siRNA or miR-519 in the presence or absence of the autophagy inhibitor 3-MA (1 mM). Forty-eight hours later, Western blot analysis was used to assess LC3-II levels. (F) RT-qPCR detection of miR-519 levels and LC3-II detection by Western blot analysis of HeLa cells transfected with Ctrl siRNA or (AS)siRNA and then subjected to 72 h of serum starvation or normal culture. Data are representative of data from at least 3 independent experiments; in panels B, C, and F, graphs represent the means and SD from at least 3 independent experiments. β-Actin was included as a loading control.
Fig 10
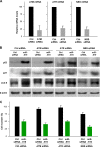
ATM, ATR, and NBS are not required for the effects of miR-519. (A) Effect of transfection of HeLa cells with ATM, ATR, or NBS siRNAs on the expression of target mRNAs, as assessed by RT-qPCR analysis 48 h after transfection of the siRNAs. (B) In cells that were transfected, as explained above for panel A, together with either Ctrl siRNA or miR-519, the abundances of p53, p21, and LC3-II were assessed by Western blot analysis. Representative data from three independent experiments are shown. (C) The effect of miR-519 on the proliferation of cells with normal or reduced ATM, ATR, or NBS levels was assessed by monitoring changes in cell numbers 48 h after the transfection of small RNAs.
Fig 11
p53 is dispensable and Ca2+-induced p21 is essential for miR-519-triggered autophagy. (A and B) HeLa cells were transfected with the small RNAs indicated, and 48 h later, the levels of LC3-II (A and B), p21 (B), and β-actin were assessed by Western blot analysis. p53 levels were reduced, as shown in Fig. 4C. (C) Parental (wt) and p21-null (p21−/−) HCT116 cells were transfected with Ctrl siRNA or miR-519. Forty-eight hours later, the p21 and LC3-II signals were assessed by Western blot analysis. (D) HeLa cells were transfected with Ctrl siRNA and miR-519 together with the parent vector (pcDNA) or pATP2C1. Forty-eight hours later, p21 and LC3-II levels were assessed by Western blot analysis. (E) Forty-eight hours after the transfection of A549, H1299, HCT116 wt, and HCT116 p53−/− cells with the small RNAs indicated, the levels of ATP2C1, ORAI1, LC3-II, and the loading control β-actin were assessed by Western blot analysis. (F) HeLa cells were transfected with Ctrl siRNA and miR-519 together with either the parent vector (pGFP) or pORAI1-GFP. Forty-eight hours later, LC3-II levels were assessed by Western blot analysis. (G) RKO (colon cancer) cells were infected with 100 PFU of either control AdGFP or Adp21, and 48 h later, the levels of GFP, p21, LC3-II, and β-actin were assessed by Western blot analysis. (H) HeLa cells were transfected with plasmid pFlag-p21 to overexpress tagged p21 or with the parent vector pFlag. Forty-eight hours later, the levels of p21, LC3-II, and β-actin were assessed by Western blot analysis. The data represent the means and SD of data from 3 independent experiments.
Fig 12
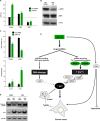
miR-519-engendered growth arrest and survival are linked to p21 upregulation. (A) ATP levels in cells were quantified 48 h after transfection with Ctrl siRNA or miR-519 in the presence or absence of 3-MA. DNP was included as a negative control. (B) Western blot analysis of the levels of total AMPK and active AMPK (p-AMPK, AMPK phosphorylated at Thr-172 of subunit α). (C and D) The influence of miR-519 on cell numbers and survival was assessed 48 h after the transfection of Ctrl siRNA or miR-519 by measuring remaining cells (C, top) and trypan blue-positive (dead) cells (bottom) and by assessing PARP cleavage by Western blot analysis (D). (E) General model depicting the events whereby miR-519 triggers growth arrest by inducing p21. The molecules showing a direct implication in the miR-519-elicited increase in p21 expression levels are shown in green. The data in panels A and C are the means and SD of data from at least three independent experiments.
Similar articles
- MicroRNA-92a Promotes Cell Proliferation in Cervical Cancer via Inhibiting p21 Expression and Promoting Cell Cycle Progression.
Su Z, Yang H, Zhao M, Wang Y, Deng G, Chen R. Su Z, et al. Oncol Res. 2017 Jan 2;25(1):137-145. doi: 10.3727/096504016X14732772150262. Oncol Res. 2017. PMID: 28081742 Free PMC article. - Ca2+-Stimulated AMPK-Dependent Phosphorylation of Exo1 Protects Stressed Replication Forks from Aberrant Resection.
Li S, Lavagnino Z, Lemacon D, Kong L, Ustione A, Ng X, Zhang Y, Wang Y, Zheng B, Piwnica-Worms H, Vindigni A, Piston DW, You Z. Li S, et al. Mol Cell. 2019 Jun 20;74(6):1123-1137.e6. doi: 10.1016/j.molcel.2019.04.003. Epub 2019 Apr 30. Mol Cell. 2019. PMID: 31053472 Free PMC article. - Inhibition of microRNA-181a may suppress proliferation and invasion and promote apoptosis of cervical cancer cells through the PTEN/Akt/FOXO1 pathway.
Xu H, Zhu J, Hu C, Song H, Li Y. Xu H, et al. J Physiol Biochem. 2016 Dec;72(4):721-732. doi: 10.1007/s13105-016-0511-7. Epub 2016 Aug 18. J Physiol Biochem. 2016. PMID: 27534652 - MicroRNA-93 Targets p21 and Promotes Proliferation in Mycosis Fungoides T Cells.
Gluud M, Fredholm S, Blümel E, Willerslev-Olsen A, Buus TB, Nastasi C, Krejsgaard T, Bonefeld CM, Woetmann A, Iversen L, Litman T, Geisler C, Ødum N, Lindahl LM. Gluud M, et al. Dermatology. 2021;237(2):277-282. doi: 10.1159/000505743. Epub 2020 Apr 24. Dermatology. 2021. PMID: 32335549 - miR-30e controls DNA damage-induced stress responses by modulating expression of the CDK inhibitor p21WAF1/CIP1 and caspase-3.
Sohn D, Peters D, Piekorz RP, Budach W, Jänicke RU. Sohn D, et al. Oncotarget. 2016 Mar 29;7(13):15915-29. doi: 10.18632/oncotarget.7432. Oncotarget. 2016. PMID: 26895377 Free PMC article.
Cited by
- Extra Virgin Olive Oil: Lesson from Nutrigenomics.
De Santis S, Cariello M, Piccinin E, Sabbà C, Moschetta A. De Santis S, et al. Nutrients. 2019 Sep 4;11(9):2085. doi: 10.3390/nu11092085. Nutrients. 2019. PMID: 31487787 Free PMC article. Review. - G Protein-Coupled Receptor Systems and Their Role in Cellular Senescence.
Santos-Otte P, Leysen H, van Gastel J, Hendrickx JO, Martin B, Maudsley S. Santos-Otte P, et al. Comput Struct Biotechnol J. 2019 Aug 23;17:1265-1277. doi: 10.1016/j.csbj.2019.08.005. eCollection 2019. Comput Struct Biotechnol J. 2019. PMID: 31921393 Free PMC article. Review. - A biochemical approach to identify direct microRNA targets.
Subramanian M, Li XL, Hara T, Lal A. Subramanian M, et al. Methods Mol Biol. 2015;1206:29-37. doi: 10.1007/978-1-4939-1369-5_3. Methods Mol Biol. 2015. PMID: 25240884 Free PMC article. - The role of trophoblastic microRNAs in placental viral infection.
Mouillet JF, Ouyang Y, Bayer A, Coyne CB, Sadovsky Y. Mouillet JF, et al. Int J Dev Biol. 2014;58(2-4):281-9. doi: 10.1387/ijdb.130349ys. Int J Dev Biol. 2014. PMID: 25023694 Free PMC article. Review. - Papillary Thyroid Cancer Remodels the Genetic Information Processing Pathways.
Iacobas DA, Iacobas S. Iacobas DA, et al. Genes (Basel). 2024 May 14;15(5):621. doi: 10.3390/genes15050621. Genes (Basel). 2024. PMID: 38790250 Free PMC article.
References
- Alonso MT, Manjarrés IM, García-Sancho JJ. 2012. Privileged coupling between Ca(2+) entry through plasma membrane store-operated Ca(2+) channels and the endoplasmic reticulum Ca(2+) pump. Mol. Cell. Endocrinol. 353: 37–44 - PubMed
Publication types
MeSH terms
Substances
LinkOut - more resources
Full Text Sources
Other Literature Sources
Research Materials
Miscellaneous

