Identifying functional microRNAs in macrophages with polarized phenotypes - PubMed (original) (raw)
Identifying functional microRNAs in macrophages with polarized phenotypes
Joel W Graff et al. J Biol Chem. 2012.
Abstract
Macrophages respond to external stimuli with rapid changes in expression of many genes. Different combinations of external stimuli lead to distinct polarized activation patterns, resulting in a spectrum of possible macrophage activation phenotypes. MicroRNAs (miRNAs) are small, noncoding RNAs that can repress the expression of many target genes. We hypothesized that miRNAs play a role in macrophage polarization. miRNA expression profiles were determined in monocyte-derived macrophages (MDMs) incubated in conditions causing activation toward M1, M2a, M2b, or M2c phenotypes. One miRNA guide strand and seven miRNA passenger strands were significantly altered. Changes were confirmed in MDMs from six separate donors. The amplitude of miRNA expression changes in MDMs was smaller than described studies of monocytes responding to inflammatory stimuli. Further investigation revealed this correlated with higher basal miRNA expression in MDMs compared with monocytes. The regulation of M1- and M2b-responsive miRNAs (miR-27a, miR-29b, miR-125a, miR-146a, miR-155, and miR-222) was similar in differentiated THP-1 cells and primary MDMs. Studies in this model revealed cross-talk between IFNγ- and LPS-associated pathways regulating miRNA expression. Furthermore, expression of M1-associated transcripts was increased in THP-1 cells transfected with mimics of miR-29b, miR-125a-5p, or miR-155. The apparent inflammatory property of miR-29b and miR-125a-5p can be at least partially explained by repression of TNFAIP3, a negative regulator of NF-κB signaling. Overall, these data suggest miRNAs can contribute to changes in macrophage gene expression that occur in different exogenous activating conditions.
Figures
FIGURE 1.
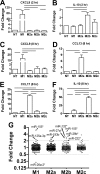
The abundance of several miRNAs was regulated differentially in MDMs incubated in distinct polarizing conditions. Polarization-specific biomarkers were analyzed by RT-qPCR assays using RNA collected from MDMs at (A and B) 2 h post-treatment and (C–F) 8 h post-treatment. Data indicate mean fold change with S.E. (n = 3). Horizontal bars indicate significant differences in Δ_Ct_ values between the underlying treatments (p < 0.05, Tukey post test). NT, no treatment. G, mean fold changes in the expression of 249 miRNAs determined by TLDA RT-qPCR assays in polarized MDMs at 8 h post-treatment compared with untreated MDMs (n = 3). Labels highlight miRNAs in which changes were significant (p < 0.05, Tukey post test).
FIGURE 2.
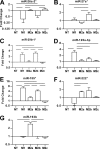
Alterations in miRNA expression were compiled from polarized MDMs of six human blood donors. Individual TaqMan RT-qPCR assays were performed using samples from three additional MDM preps treated with polarizing conditions for 8 h. Individual TaqMan assays and TLDA assays use identical primers/probes; thus, data from both types of assays were compiled for statistical analyses. Data indicate mean fold change with S.E. (n = 6). Horizontal bars indicate significant differences in Δ_Ct_ values between the underlying treatments (p < 0.05, Tukey post test). NT, no treatment.
FIGURE 3.
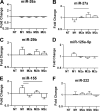
Small changes in expression of miRNA guide strands in MDMs often mirror larger changes in miRNA passenger strands. For each miRNA passenger strand analyzed in Fig. 2, the changes in abundance of each corresponding miRNA guide strand at 8 h post-treatment with M1, M2a, M2b, and M2c conditions relative to untreated controls was determined from the TLDA data (A–C, and F; n = 3). Both TLDA results and additional miRNA-specific RT-qPCR results were used to generate data in D and E (n = 6). Mean fold changes are shown with S.E. Horizontal bars indicate significant differences in Δ_Ct_ values between the underlying treatments (p < 0.05, Tukey post test). NT, no treatment.
FIGURE 4.
High basal miRNA expression levels in macrophages correlates with gradual accumulation of guide strands and transient accumulation of passenger strands for stimulus-responsive miRNAs. A, the mean increases in expression for the indicated miRNAs were estimated using the mean Δ_Ct_ values determined from miRNA RT-qPCR assays. Samples for these assays were collected from monocytes immediately isolated from human peripheral blood mononuclear cells (n = 2) and MDMs after 5 days of culture without polarizing treatments (n = 4–6). B and C, RT-qPCR was performed using RNA isolated from PMA-differentiated THP-1 cells treated with LPS (100 ng/ml) for 1, 3, 8, or 24 h. Mean fold changes are shown with S.E. for miR-155 and miR-125a strand pairs relative to untreated cells (n = 2).
FIGURE 5.
miRNA expression in PMA-differentiated THP-1 cells exposed to polarizing conditions. RNA was collected from PMA-differentiated THP-1 cells 8 h after polarizing treatments. RT-qPCR was performed to determine changes in abundance of miRNA guide strands (A–E) and miRNA passenger strands (A_′_–E_′). Mean fold changes are shown with S.E. (n = 3). Horizontal bars indicate significant differences in Δ_Ct values between the underlying treatments (p < 0.05, Tukey post test). NT, no treatment.
FIGURE 6.
IFNγ treatment can antagonize the induction of several LPS-responsive miRNAs in differentiated THP-1 cells. RNA was collected from THP-1 cells following 8 h of treatment with IFNγ (20 ng/ml), LPS (10 ng/ml), or M1-polarizing conditions (20 ng/ml IFNγ and 10 ng/ml LPS). RT-qPCR was performed to determine changes in abundance of miRNA guide strands (A–F) and miRNA passenger strands (A_′_–E_′). Mean fold change are shown with S.E. (n = 3). Horizontal bars indicate significant differences in Δ_Ct values between the underlying treatments (p < 0.05, Tukey post test). NT, no treatment.
FIGURE 7.
LPS-mediated induction of several miRNAs is enhanced by IgG co-treatment in differentiated THP-1 cells. RNA was collected from THP-1 cells following 8 h of incubation in IgG-coated wells alone, treatment with LPS (100 ng/ml), or M2b-polarizing conditions (IgG-coated wells and 100 ng/ml LPS). RT-qPCR was performed to determine changes in abundance of (A–F) miRNA guide strands or (A_′_–E_′) miRNA passenger strands. Mean fold changes are shown with S.E. (n = 3). Horizontal bars indicate significant differences in Δ_Ct values between the underlying treatments (p < 0.05, Tukey post test). NT, no treatment.
FIGURE 8.
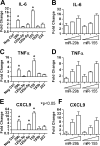
Introduction of mimics of miRNAs can alter macrophage phenotypes. A, C, and E, RNA was collected from THP-1 cells 48 h post-transfection with miRNA mimics (50 n
m
). This was used as a template in real time RT-qPCR analysis of IL-6, TNFα, and CXCL9 transcripts. Asterisks indicate significant differences in Δ_Ct_ values (p < 0.05, Dunnett post test). B, D, and F, RNA was collected and analyzed similar to A–C, except a range of miRNA mimic concentrations (2, 10, and 50 n
m
) of either miR-29b or miR-155 was used. Data represent the mean with S.E. fold changes in mRNA abundance between cells transfected with the indicated mimic and the negative control mimic (n = 3).
FIGURE 9.
miR-29b and miR-125a-5p repress expression of a luciferase reporter under control of the 3′-UTR of TNFAIP3, a negative regulator of NF-κB signaling. A, Dual-Luciferase assays were performed using lysates of HEK293 cells 48 h after transfection with psiCHECK2-based plasmids with the TNFAIP3 3′-UTR, or a perfect match target of the indicted miRNA, downstream of the Renilla luciferase reporter. The pAAV-hrGFP-based plasmids, pGFP-29b, or pGFP-125a, were co-transfected with the reporter. Renilla luciferase activity (RLuc) was normalized to activity of firefly luciferase (FLuc), also encoded on the psiCHECK-2 vector. B, independent experiments were performed as described in A using psiCHECK2-based plasmids containing mutations within the predicted miR-29b and miR-125a-5p binding sites of the TNFAIP3 3′-UTR, TNFAIP3Δ29b, and TNFAIP3Δ125a, respectively. Normalized Rluc:Fluc ratios are shown as mean with S.E. (n = 3). Asterisks indicate significant differences in luciferase ratios (p < 0.01, Dunnett post test).
Similar articles
- Regulation of activation-associated microRNA accumulation rates during monocyte-to-macrophage differentiation.
Eigsti RL, Sudan B, Wilson ME, Graff JW. Eigsti RL, et al. J Biol Chem. 2014 Oct 10;289(41):28433-47. doi: 10.1074/jbc.M114.599316. Epub 2014 Aug 22. J Biol Chem. 2014. PMID: 25148686 Free PMC article. - Dynamic macrophage polarization-specific miRNA patterns reveal increased soluble VEGF receptor 1 by miR-125a-5p inhibition.
Melton DW, Lei X, Gelfond JA, Shireman PK. Melton DW, et al. Physiol Genomics. 2016 May;48(5):345-60. doi: 10.1152/physiolgenomics.00098.2015. Epub 2016 Feb 16. Physiol Genomics. 2016. PMID: 26884460 Free PMC article. - Monocyte MicroRNA Expression in Active Systemic Juvenile Idiopathic Arthritis Implicates MicroRNA-125a-5p in Polarized Monocyte Phenotypes.
Schulert GS, Fall N, Harley JB, Shen N, Lovell DJ, Thornton S, Grom AA. Schulert GS, et al. Arthritis Rheumatol. 2016 Sep;68(9):2300-13. doi: 10.1002/art.39694. Arthritis Rheumatol. 2016. PMID: 27014994 Free PMC article. - MiRNA-Mediated Macrophage Polarization and its Potential Role in the Regulation of Inflammatory Response.
Essandoh K, Li Y, Huo J, Fan GC. Essandoh K, et al. Shock. 2016 Aug;46(2):122-31. doi: 10.1097/SHK.0000000000000604. Shock. 2016. PMID: 26954942 Free PMC article. Review. - Regulation of the MIR155 host gene in physiological and pathological processes.
Elton TS, Selemon H, Elton SM, Parinandi NL. Elton TS, et al. Gene. 2013 Dec 10;532(1):1-12. doi: 10.1016/j.gene.2012.12.009. Epub 2012 Dec 14. Gene. 2013. PMID: 23246696 Review.
Cited by
- Generation of Myeloid-Derived Suppressor Cells Mediated by MicroRNA-125a-5p in Melanoma.
Lasser S, Ozbay Kurt FG, Fritz L, Gutzeit N, De La Torre C, Altevogt P, Utikal J, Umansky V. Lasser S, et al. Int J Mol Sci. 2024 Jun 18;25(12):6693. doi: 10.3390/ijms25126693. Int J Mol Sci. 2024. PMID: 38928399 Free PMC article. - Control of the Inflammatory Macrophage Transcriptional Signature by miR-155.
Jablonski KA, Gaudet AD, Amici SA, Popovich PG, Guerau-de-Arellano M. Jablonski KA, et al. PLoS One. 2016 Jul 22;11(7):e0159724. doi: 10.1371/journal.pone.0159724. eCollection 2016. PLoS One. 2016. PMID: 27447824 Free PMC article. - MicroRNAs: As Critical Regulators of Tumor- Associated Macrophages.
Chatterjee B, Saha P, Bose S, Shukla D, Chatterjee N, Kumar S, Tripathi PP, Srivastava AK. Chatterjee B, et al. Int J Mol Sci. 2020 Sep 27;21(19):7117. doi: 10.3390/ijms21197117. Int J Mol Sci. 2020. PMID: 32992449 Free PMC article. Review. - A regulatory role for microRNA 33* in controlling lipid metabolism gene expression.
Goedeke L, Vales-Lara FM, Fenstermaker M, Cirera-Salinas D, Chamorro-Jorganes A, Ramírez CM, Mattison JA, de Cabo R, Suárez Y, Fernández-Hernando C. Goedeke L, et al. Mol Cell Biol. 2013 Jun;33(11):2339-52. doi: 10.1128/MCB.01714-12. Epub 2013 Apr 1. Mol Cell Biol. 2013. PMID: 23547260 Free PMC article. - Myeloperoxidase-Oxidized LDLs Enhance an Anti-Inflammatory M2 and Antioxidant Phenotype in Murine Macrophages.
Pireaux V, Sauvage A, Bihin B, Van Steenbrugge M, Rousseau A, Van Antwerpen P, Zouaoui Boudjeltia K, Raes M. Pireaux V, et al. Mediators Inflamm. 2016;2016:8249476. doi: 10.1155/2016/8249476. Epub 2016 Aug 30. Mediators Inflamm. 2016. PMID: 27656049 Free PMC article.
References
- Martinez F. O., Sica A., Mantovani A., Locati M. (2008) Macrophage activation and polarization. Front Biosci. 13, 453–461 - PubMed
- Mosser D. M. (2003) The many faces of macrophage activation. J. Leukoc. Biol. 73, 209–212 - PubMed
Publication types
MeSH terms
Substances
Grants and funding
- R01 AI045540/AI/NIAID NIH HHS/United States
- R21 AI080801/AI/NIAID NIH HHS/United States
- R01 AI067874/AI/NIAID NIH HHS/United States
- R01 AI076233/AI/NIAID NIH HHS/United States
- T32 AI007511/AI/NIAID NIH HHS/United States
- T32 AI007343-21/AI/NIAID NIH HHS/United States
- T32 GM007337/GM/NIGMS NIH HHS/United States
LinkOut - more resources
Full Text Sources


