Optic glomeruli and their inputs in Drosophila share an organizational ground pattern with the antennal lobes - PubMed (original) (raw)
Optic glomeruli and their inputs in Drosophila share an organizational ground pattern with the antennal lobes
Laiyong Mu et al. J Neurosci. 2012.
Abstract
Studying the insect visual system provides important data on the basic neural mechanisms underlying visual processing. As in vertebrates, the first step in visual processing in insects is through a series of retinotopic neurons. Recent studies on flies have found that these converge onto assemblies of columnar neurons in the lobula, the axons of which segregate to project to discrete optic glomeruli in the lateral protocerebrum. This arrangement is much like the fly's olfactory system, in which afferents target uniquely identifiable olfactory glomeruli. Here, whole-cell patch recordings show that even though visual primitives are unreliably encoded by single lobula output neurons because of high synaptic noise, they are reliably encoded by the ensemble of outputs. At a glomerulus, local interneurons reliably code visual primitives, as do projection neurons conveying information centrally from the glomerulus. These observations demonstrate that in Drosophila, as in other dipterans, optic glomeruli are involved in further reconstructing the fly's visual world. Optic glomeruli and antennal lobe glomeruli share the same ancestral anatomical and functional ground pattern, enabling reliable responses to be extracted from converging sensory inputs.
Figures
Figure 1.
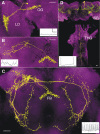
A, B, Ensembles of complex output LCNs resolved by anti-GFP labeling of the GAL4 lines NP5092 (A) and NP3045 (B). A, Left, Hemisection through the brain labeled with anti-α-tubulin and anti-GFP, showing the ensemble of type Col A LCN neurons in the lobula with converging axons to its corresponding Col A glomerulus. This lies ventral and medial to a glomerulus receiving terminals of neurons with dendrites in both the lobula plate and the lobula (LPL neurons), belonging to the morphological type LPL2CN neurons resolved by anti-GFP labeling of the GAL4 line NP5092. An individual recorded and dye-filled neuron of this ensemble is shown in Figure 5_A_. Right, Reconstruction of 14 of the 24 glomeruli, most of which are in the inferior lateral protocerebrum (bracketed), each supplied by an ensemble of columnar output neurons from the lobula complex (lobula plate and lobula). The depth shown here, from the level of the FB, is ∼40 μm. Glomeruli are color coded according to depth and are identified from serial vertical sections of brains labeled by “tricolor” labeling (elav-GAL4 > UAS-DsRed, UAS-n-syb::GFP, UAS-Rdl-HA) to resolve presynaptic and postsynaptic densities, glia, and other aspects of neuropils and their connections (see
http://flybrain.iam.u-tokyo.ac.jp/flydb091226/php/flydb/index.php
). Two anterior glomeruli, receiving inputs from the Col A and LPL2CN neurons, lie in front of a more posterior glomerulus supplied by L1CN neurons (see B). FB, Fan-shaped body of the central complex; LH, lateral horn; LO, lobula; LOP, lobula plate; ME, medulla; PED, pedunculus of the mushroom body; SP superior protocerebrum. Abbreviations and terms follow standard nomenclature for the Drosophila brain. B, Palisade ensemble of the lobula columnar output neuron L1CN, resolved by anti-GFP labeling of the GAL4 line NP3045. Somata (bracketed), from which patch-clamp recordings were obtained, reside in a uniquely identifiable location above and medial to the lobula upper margin. Left, Columnar neurons after section-by-section image deletion of other profiles expressing GFP. Right, All profiles resolved at this level before removal. Scale bars, 50 μm.
Figure 2.
Experimental setup. A, The whole-cell patch-recording setup. Flies were inserted into a square of aluminum foil attached to a Petri dish. The dorsal–ventral axis of the animal's body was fixed perpendicularly to the horizontal plane defined by the foil. The head of the fly was bent downward until the posterior plane of its head was horizontal. The back of the head was bathed in saline, and the eyes remained in air to receive visual stimuli from LED panel beneath. B, The subtended visual field was 59° horizontally and 67° vertically. C, Visual stimuli included flicker, three types of motion pattern, square grating, single bar, and sinusoidal grating, moving in four or eight different directions, and static square gratings at four different orientations.
Figure 3.
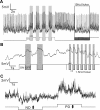
Visual stimuli evoke spiking, nonspiking, or mixed responses in different Drosophila neurons. A, A spiking neuron showing changes of firing rate to light ON and light OFF. B, A nonspiking neuron showing depolarizing membrane potentials to the OFF component of flicker. C, A VS neuron showing direction-selective responses to vertical motion stimuli, with both graded membrane potential change and action potential spikelets. PD, Preferred direction; ND, null direction.
Figure 4.
Scanning confocal micrographs of nonspiking and spiking neurons show that anatomy correlates with information transfer (insets). A, A nonspiking LCN with a terminal in a dorsoanterior optic glomerulus (OG). Axon lengths, 80–90 μm; diameters <0.5 μm. B, One of a bilateral pair of uniquely identifiable protocerebral interneurons associated with the fan-shaped body (FB) of the central complex, showing mixed membrane potential fluctuations and action potentials. Axon lengths, 70–80 μm; diameters, ∼0.5 μm. C, One of a pair of uniquely identifiable spiking interneurons associated with the FB of the central complex and extensions to protocerebral and deutocerebral regions. Axon lengths, 395–410 μm; diameters, 1.0–1.5 μm. D, A spiking descending neuron linking the protocerebrum of the brain (BR) to thoracic ganglia (THG). Axon length, 500–700 μm; diameters, 1.5–3 μm. Scale bars, 20 μm. Calibration: A–C, 5 mV/500 ms; D, 10 mV/500 ms. LO, Lobula.
Figure 5.
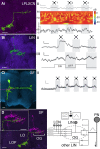
Neural integration enhances sensitivity to looming stimuli. A–C, Left, Confocal images of recorded neurons. Scale bars, 20 μm. Right, Corresponding recordings. Calibration: 2 mV/500 ms. Aii, Power spectrum analysis illustrates the nonspiking LPL2CN responding to the looming stimuli 2 and 3. The first trace is the recording sample. The time–frequency plot in the middle shows the power of membrane potential oscillations calculated from the recording sample above. The line plot at the bottom shows averaged powers (2–80 Hz) throughout the stimulus calculated from the time–frequency plot above. B, The unambiguous and rapidly adapting responses to looming and full-field flicker stimuli of the LIN in the GF glomerulus. C, The GF and its depolarizing response to looming stimuli. An image of the terminal of LPL2CN (pink) is superimposed on the GF dendrites to indicate their overlap in the GF glomerulus. D, Convergent processing in the optic glomerulus. Left, Montage showing overlap at the same optic glomerulus [bracketed optic glomerulus (OG)] of the recorded LIN (pink) and the axon terminal of a recorded LPL (green). This species of neuron, LPL2CN, belongs to the class of LPLs characterized by their dendrites in the lobula (LO) and lobula plate (LOP). Inset, Enlargement of the related glomerulus. Right, Schematic to illustrate convergence of LCNs to an OG. Responses of the LCNs are summed (Σ) and carried by the LIN relaying to its cognate projection neuron (PN). PNs of OG receive additional LIN inputs.
Figure 6.
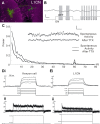
The nonspiking nature of a single L1CN labeled in the GAL4 line NP3045. A, A single recorded and biocytin-filled LCN. Scale bar, 10 μm. B, Responses of a single L1CN showing typical nonspiking fast and slow membrane potential fluctuations, which appear to be unrelated to the visual ON/OFF stimuli. C, Plot showing averaged power fluctuations before and after applying TTX to the lobula. Inset, Sample recordings before and after application. Applying TTX reduces both fast and slow membrane potential fluctuations. D, E, Current-clamp (Di, Ei) and voltage-clamp (Dii, Eii) recordings from a Kenyon cell (D) and an L1CN cell (E). Action potentials and inward voltage active currents can be initiated in Kenyon cells but not in L1CN cells.
Figure 7.
L1CNs respond to slow flicker. A, Responses of a single L1CN. Ai, Membrane potential recordings in four successive trials. Aii, Time–frequency plot showing the power of membrane potential oscillations during the stimulus, averaged from the four trials shown in Ai. Aiii, Line plot showing averaged powers (2–80 Hz) throughout the stimulus calculated from the time–frequency plot of Aii. This L1CN showed weak response to slow flicker. B, Time–frequency plot of averaged response from grouped L1CNs (N = 33). Letters indicate time windows where the averaged powers were statistically compared (Bii: a, b, 200 ms; c, 800 ms; d, 700 ms; e, 300 ms). C, Averaged decibel power at various time windows during the stimulus (mean ± SEM). Both light ON and light OFF initiate significantly increased power of membrane potential fluctuations. *p ≤ 0.05.
Figure 8.
L1CNs respond selectively to a single bar moving in a downward direction. A, Responses to single-bar motion of an individual L1CN. Ai, Sample recordings in four successive trials for each stimulus direction. Aii, Time–frequency plots during the stimulus averaged from each of the four sets of trials shown in Ai. Aiii, Line plots showing the mean power (2–80 Hz) change throughout the stimulus for each stimulus direction. B, Time–frequency plot of averaged responses from grouped LCNs (N = 25) for each direction. Bii, Line plots show the averaged power (2–80 Hz) change throughout the stimulus calculated from the time–frequency plots in Bi. Arrows, Direction of the motion pattern with respect to the head of the fly. C, Mean power during 200 ms before (gray bar) and after (black bar) motion stimulus onset for different directions (mean ± SEM). Downward (270°) motion initiated a significant response (p ≤ 0.05). D, Polar plots of mean power difference between 200 ms before and after motion stimulus onset for different directions. Gray area, Mean ± SEM; inner dotted line, zero power change.
Figure 9.
L1CNs do not show significant responses to directional square-wave gratings motion, sinusoidal gratings motion, and presenting static square-wave gratings. The bar graphs show the mean power in 200 ms before (gray bar) and 200 ms after (black bar) the beginning of the motion stimuli at different directions or displaying static patterns at the different orientations (mean ± SEM). Arrows, Direction of the motion pattern with respect to the head of the fly. A, Square-wave gratings moving in eight different directions (N = 28; p > 0.05). B, Sinusoidal gratings moving in four different directions (N = 26; p > 0.05). C, Static square-wave gratings at four different orientations (N = 28; p > 0.05).
Figure 10.
Schematic comparing central segregation of coded channels to olfactory and optic glomeruli. Olfactory receptor neurons encoding data about specific ligands segregate to unique olfactory glomeruli, 40 of which are located in the Drosophila deutocerebrum (Laissue et al., 1999). Each genetically defined clone of lobula outputs with dendrites in specific layers of the lobula encodes data about specific visual primitives. Axons from each clone segregate to unique optic glomeruli, 18 of which are found in the Drosophila protocerebrum (Otsuna and Ito, 2006).
Similar articles
- Organization of local interneurons in optic glomeruli of the dipterous visual system and comparisons with the antennal lobes.
Strausfeld NJ, Sinakevitch I, Okamura JY. Strausfeld NJ, et al. Dev Neurobiol. 2007 Sep 1;67(10):1267-88. doi: 10.1002/dneu.20396. Dev Neurobiol. 2007. PMID: 17638381 - Visual system of calliphorid flies: organization of optic glomeruli and their lobula complex efferents.
Strausfeld NJ, Okamura JY. Strausfeld NJ, et al. J Comp Neurol. 2007 Jan 1;500(1):166-88. doi: 10.1002/cne.21196. J Comp Neurol. 2007. PMID: 17099891 - Systematic analysis of the visual projection neurons of Drosophila melanogaster. I. Lobula-specific pathways.
Otsuna H, Ito K. Otsuna H, et al. J Comp Neurol. 2006 Aug 20;497(6):928-58. doi: 10.1002/cne.21015. J Comp Neurol. 2006. PMID: 16802334 - Dynamic structural changes of synaptic contacts in the visual system of insects.
Pyza E. Pyza E. Microsc Res Tech. 2002 Aug 15;58(4):335-44. doi: 10.1002/jemt.10141. Microsc Res Tech. 2002. PMID: 12214300 Review. - Optic lobe development.
Fischbach KF, Hiesinger PR. Fischbach KF, et al. Adv Exp Med Biol. 2008;628:115-36. doi: 10.1007/978-0-387-78261-4_8. Adv Exp Med Biol. 2008. PMID: 18683642 Review.
Cited by
- Morphology and synapse topography optimize linear encoding of synapse numbers in Drosophila looming responsive descending neurons.
Moreno-Sanchez A, Vasserman AN, Jang H, Hina BW, von Reyn CR, Ausborn J. Moreno-Sanchez A, et al. bioRxiv [Preprint]. 2024 Apr 28:2024.04.24.591016. doi: 10.1101/2024.04.24.591016. bioRxiv. 2024. PMID: 38712267 Free PMC article. Preprint. - A Closer Look at Histamine in Drosophila.
Volonté C, Liguori F, Amadio S. Volonté C, et al. Int J Mol Sci. 2024 Apr 18;25(8):4449. doi: 10.3390/ijms25084449. Int J Mol Sci. 2024. PMID: 38674034 Free PMC article. Review. - Multivariate classification of multichannel long-term electrophysiology data identifies different sleep stages in fruit flies.
Jagannathan SR, Jeans T, Van De Poll MN, van Swinderen B. Jagannathan SR, et al. Sci Adv. 2024 Feb 23;10(8):eadj4399. doi: 10.1126/sciadv.adj4399. Epub 2024 Feb 21. Sci Adv. 2024. PMID: 38381836 Free PMC article. - Multivariate classification of multichannel long-term electrophysiology data identifies different sleep stages in fruit flies.
Jagannathan SR, Jeans R, Van De Poll MN, van Swinderen B. Jagannathan SR, et al. bioRxiv [Preprint]. 2023 Jun 13:2023.06.12.544704. doi: 10.1101/2023.06.12.544704. bioRxiv. 2023. PMID: 37398087 Free PMC article. Updated. Preprint. - Visual processing in the fly, from photoreceptors to behavior.
Currier TA, Pang MM, Clandinin TR. Currier TA, et al. Genetics. 2023 May 26;224(2):iyad064. doi: 10.1093/genetics/iyad064. Genetics. 2023. PMID: 37128740 Free PMC article.
References
- Autrum H, Zettler F, Järvilehto M. Postsynaptic potentials from a single monopolar neuron of the ganglion opticum I of the blowfly Calliphora. J Comp Physiol A. 1970;70:414–424.
- Bacon JP, Strausfeld NJ. The dipteran ‘Giant fibre’ pathway: neurons and signals. J Comp Physiol A. 1986;158:529–548.
- Bausenwein B, Dittrich AP, Fischbach KF. The optic lobe of Drosophila melanogaster. II. Sorting of retinotopic pathways in the medulla. Cell Tissue Res. 1992;267:17–28. - PubMed
- Borst A, Haag J. The intrinsic electrophysiological characteristics of fly lobula plate tangential cells. I. Passive membrane properties. J Comput Neurosci. 1996;3:313–336. - PubMed
- Burrows M. The neurobiology of an insect brain. Oxford: Oxford UP; 1996.
Publication types
MeSH terms
LinkOut - more resources
Full Text Sources
Molecular Biology Databases
Research Materials


