Genome-wide copy number analysis of single cells - PubMed (original) (raw)
. 2012 May 3;7(6):1024-41.
doi: 10.1038/nprot.2012.039.
Jude Kendall, Linda Rodgers, Hilary Cox, Mike Riggs, Asya Stepansky, Jennifer Troge, Kandasamy Ravi, Diane Esposito, B Lakshmi, Michael Wigler, Nicholas Navin, James Hicks
Affiliations
- PMID: 22555242
- PMCID: PMC5069701
- DOI: 10.1038/nprot.2012.039
Genome-wide copy number analysis of single cells
Timour Baslan et al. Nat Protoc. 2012.
Erratum in
- Corrigendum: Genome-wide copy number analysis of single cells.
Baslan T, Kendall J, Rodgers L, Cox H, Riggs M, Stepansky A, Troge J, Ravi K, Esposito D, Lakshmi B, Wigler M, Navin N, Hicks J. Baslan T, et al. Nat Protoc. 2016 Mar;11(3):616. doi: 10.1038/nprot0316.616b. Epub 2016 Feb 25. Nat Protoc. 2016. PMID: 26914320 No abstract available.
Abstract
Copy number variation (CNV) is increasingly recognized as an important contributor to phenotypic variation in health and disease. Most methods for determining CNV rely on admixtures of cells in which information regarding genetic heterogeneity is lost. Here we present a protocol that allows for the genome-wide copy number analysis of single nuclei isolated from mixed populations of cells. Single-nucleus sequencing (SNS), combines flow sorting of single nuclei on the basis of DNA content and whole-genome amplification (WGA); this is followed by next-generation sequencing to quantize genomic intervals in a genome-wide manner. Multiplexing of single cells is discussed. In addition, we outline informatic approaches that correct for biases inherent in the WGA procedure and allow for accurate determination of copy number profiles. All together, the protocol takes ∼3 d from flow cytometry to sequence-ready DNA libraries.
Figures
Figure 1
Schematic of the experimental workflow of SNS. Step numbering corresponds to the Steps of the Procedure. The FACS Aria image is courtesy of © Bacton, Dickinson and Company. Reprinted with permission. HiSeq2000 image is courtesy of Illumina, Inc.
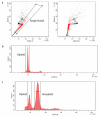
Figure 2
Flow sorting of single nuclei based on DNA content. (a) Dot plot view of DAPI stained nuclei. Gate, drawn on the diagonal, excludes cellular debris and doublets and captures single nuclei. The black dots represent cellular debris and doublets, while the green and red dots represent diploid and non-diploid fractions from the single nuclei gate respectively. The dot plots are drawn with DAPI-H and DAPI-W to allow for enhanced precision in distinguishing subpopulations. (b,c) Examples of histograms drawn from single nuclei gates illustrating a diploid profile (b), and an aneuploidy profile (c).
Figure 3
WGA amplification profiles of single cell DNA from 4 different single cells. (a) WGA DNA spreads (100-1000bps) of single cell genomes as measured on the Bioanalyzer. S1-S2-S3-S4 refers to 4 different single cell amplified products. (b) An example histogram of DNA spread from cell S1 as measured by the Bioanalyzer.
Figure 4
Sonication profiles of WGA DNA using different sonication programs on the Covaris E210 instrument. (a) Sonication profiles as measured on the Bioanalyzer S1: non-sonicated WGA DNA. S1 400 / S1 300 / S1 200: WGA DNA sonicated using 400+/− ∣300+/− ∣ 200+/− Covaris E210 programs respectively. Profiles represent size distributions of DNA molecules (in base pairs) of the samples. The choice of which sonication program to use is dependent upon the desired sequencing library length and the type of sequencing that will be implemented. We generally use the 300+/− program when sequencing 76 base pair reads on the Illumina platform. (b) Histograms illustrating sonication profiles as measure by the Bioanalyzer.
Figure 5
Sequencing library size profiles following AMPure bead purification using different volumes of beads. The amount of beads indicated was added to a ligation reaction of 75 μL volume (50 – 40 – 30 – 20 μL of beads). Replicas are shown. Profiles illustrate the differing sequence library size profiles obtained when using different volumes of AMPure beads. We generally perform library purification using 30 μL of beads and sequence 76 base pairs on the Illumina platform.
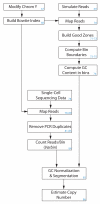
Figure 6
Schematic of the informatics workflow of SNS. Blue number inserts refer to the Steps of the Procedure.
Figure 7
Genome plot of normalized bin counts and segmentation illustrating the genome wide copy number profile of example single cell SRR054616. Blue line shows the seg.mean values from the Circular-Binary-Segmentation (CBS).
Figure 8
Density plot of segment value differences. The density plot shows the Gaussian kernel smoothed density of differences in seg.mean values for differences between all segments called by the segmentor weighted by segment length. The second peak represents the mode of the seg.mean difference between segments one copy number apart.
Figure 9
A close up view of a region on chromosome 4 illustrating normalized bin count for each bin on the chromosomal segment. The blue line is the seg.mean as called by the CBS segmentation algorithm. The red line is the estimated copy number.
Figure 10
Representative illustration of Genome Sector Loss (GSL), where large homozygous deletions and patterns consistent with chromosomal “shredding” are evident. (a) Whole genome view of a single cell collected out of a “normal” diploid flow sorting gate. (b) A close up view of the profile of the same cell on chromosomes 7 and 8.
Similar articles
- A new workflow for whole-genome sequencing of single human cells.
Binder V, Bartenhagen C, Okpanyi V, Gombert M, Moehlendick B, Behrens B, Klein HU, Rieder H, Ida Krell PF, Dugas M, Stoecklein NH, Borkhardt A. Binder V, et al. Hum Mutat. 2014 Oct;35(10):1260-70. doi: 10.1002/humu.22625. Epub 2014 Aug 18. Hum Mutat. 2014. PMID: 25066732 - The Performance of Whole Genome Amplification Methods and Next-Generation Sequencing for Pre-Implantation Genetic Diagnosis of Chromosomal Abnormalities.
Li N, Wang L, Wang H, Ma M, Wang X, Li Y, Zhang W, Zhang J, Cram DS, Yao Y. Li N, et al. J Genet Genomics. 2015 Apr 20;42(4):151-9. doi: 10.1016/j.jgg.2015.03.001. Epub 2015 Mar 14. J Genet Genomics. 2015. PMID: 25953353 - Performance of four modern whole genome amplification methods for copy number variant detection in single cells.
Deleye L, Tilleman L, Vander Plaetsen AS, Cornelis S, Deforce D, Van Nieuwerburgh F. Deleye L, et al. Sci Rep. 2017 Jun 13;7(1):3422. doi: 10.1038/s41598-017-03711-y. Sci Rep. 2017. PMID: 28611458 Free PMC article. - [Comparison of different single cell whole genome amplification methods and MALBAC applications in assisted reproduction].
Yao YX, La YF, Di R, Liu QY, Hu WP, Wang XY, Chu MX. Yao YX, et al. Yi Chuan. 2018 Aug 16;40(8):620-631. doi: 10.16288/j.yczz.18-091. Yi Chuan. 2018. PMID: 30117418 Review. Chinese. - Exome sequencing and whole genome sequencing for the detection of copy number variation.
Hehir-Kwa JY, Pfundt R, Veltman JA. Hehir-Kwa JY, et al. Expert Rev Mol Diagn. 2015;15(8):1023-32. doi: 10.1586/14737159.2015.1053467. Epub 2015 Jun 18. Expert Rev Mol Diagn. 2015. PMID: 26088785 Review.
Cited by
- Altered levels of mitochondrial DNA are associated with female age, aneuploidy, and provide an independent measure of embryonic implantation potential.
Fragouli E, Spath K, Alfarawati S, Kaper F, Craig A, Michel CE, Kokocinski F, Cohen J, Munne S, Wells D. Fragouli E, et al. PLoS Genet. 2015 Jun 3;11(6):e1005241. doi: 10.1371/journal.pgen.1005241. eCollection 2015 Jun. PLoS Genet. 2015. PMID: 26039092 Free PMC article. - Chimera: The spoiler in multiple displacement amplification.
Lu N, Qiao Y, Lu Z, Tu J. Lu N, et al. Comput Struct Biotechnol J. 2023 Feb 23;21:1688-1696. doi: 10.1016/j.csbj.2023.02.034. eCollection 2023. Comput Struct Biotechnol J. 2023. PMID: 36879882 Free PMC article. Review. - Single-Cell Analysis of Circulating Tumor Cells.
Thiele JA, Pitule P, Hicks J, Kuhn P. Thiele JA, et al. Methods Mol Biol. 2019;1908:243-264. doi: 10.1007/978-1-4939-9004-7_17. Methods Mol Biol. 2019. PMID: 30649733 Free PMC article. - Chromosomal scan of single sperm cells by combining fluorescence-activated cell sorting and next-generation sequencing.
Tran QT, Jatsenko T, Poolamets O, Tšuiko O, Lubenets D, Reimand T, Punab M, Peters M, Salumets A. Tran QT, et al. J Assist Reprod Genet. 2019 Jan;36(1):91-97. doi: 10.1007/s10815-018-1340-0. Epub 2018 Nov 9. J Assist Reprod Genet. 2019. PMID: 30411275 Free PMC article. - Genomic alterations and evolution of cell clusters in metastatic invasive micropapillary carcinoma of the breast.
Shi Q, Shao K, Jia H, Cao B, Li W, Dong S, Liu J, Wu K, Liu M, Liu F, Zhou H, Lv J, Gu F, Li L, Zhu S, Li S, Li G, Fu L. Shi Q, et al. Nat Commun. 2022 Jan 10;13(1):111. doi: 10.1038/s41467-021-27794-4. Nat Commun. 2022. PMID: 35013309 Free PMC article.
References
- Beckmann JS, Estivill X, Antonarakis SE. Copy number variants and genetic traits: closer to the resolution of phenotypic to genotypic variability. Nat Rev Genet. 2007;8:639–646. - PubMed
Publication types
MeSH terms
LinkOut - more resources
Full Text Sources
Other Literature Sources


