The complete chloroplast DNA sequence of Eleutherococcus senticosus (Araliaceae); comparative evolutionary analyses with other three asterids - PubMed (original) (raw)
The complete chloroplast DNA sequence of Eleutherococcus senticosus (Araliaceae); comparative evolutionary analyses with other three asterids
Dong-Keun Yi et al. Mol Cells. 2012 May.
Abstract
This study reports the complete chloroplast (cp) DNA sequence of Eleutherococcus senticosus (GenBank: JN 637765), an endangered endemic species. The genome is 156,768 bp in length, and contains a pair of inverted repeat (IR) regions of 25,930 bp each, a large single copy (LSC) region of 86,755 bp and a small single copy (SSC) region of 18,153 bp. The structural organization, gene and intron contents, gene order, AT content, codon usage, and transcription units of the E. senticosus chloroplast genome are similar to that of typical land plant cp DNA. We aligned and analyzed the sequences of 86 coding genes, 19 introns and 113 intergenic spacers (IGS) in three different taxonomic hierarchies; Eleutherococcus vs. Panax, Eleutherococcus vs. Daucus, and Eleutherococcus vs. Nicotiana. The distribution of indels, the number of polymorphic sites and nucleotide diversity indicate that positional constraint is more important than functional constraint for the evolution of cp genome sequences in Asterids. For example, the intron sequences in the LSC region exhibited base substitution rates 5-11-times higher than that of the IR regions, while the intron sequences in the SSC region evolved 7-14-times faster than those in the IR region. Furthermore, the Ka/Ks ratio of the gene coding sequences supports a stronger evolutionary constraint in the IR region than in the LSC or SSC regions. Therefore, our data suggest that selective sweeps by base collection mechanisms more frequently eliminate polymorphisms in the IR region than in other regions. Chloroplast genome regions that have high levels of base substitutions also show higher incidences of indels. Thirty-five simple sequence repeat (SSR) loci were identified in the Eleutherococcus chloroplast genome. Of these, 27 are homopolymers, while six are di-polymers and two are tri-polymers. In addition to the SSR loci, we also identified 18 medium size repeat units ranging from 22 to 79 bp, 11 of which are distributed in the IGS or intron regions. These medium size repeats may contribute to developing a cp genome-specific gene introduction vector because the region may use for specific recombination sites.
Figures
Fig. 1.
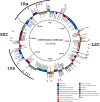
The gene map of Eleutherococcus senticosus cp genome. A pair of thick lines at the outmost circle represents the inverted repeats (IRa and IRb; 25,930 bp each), which separate the large single copy region (LSC; 86,755 bp) from the small single copy region (SSC; 18,153 bp). Genes drawn inside the circle are transcribed clockwise, while those drawn outside the circle are transcribed counterclockwise. Intron-containing genes are marked by asterisks. The numbers at the outmost circle indicate the locations of 18 repeats including direct (black number), palimdromic (blue number), and dispersed repeats (red numbers), respectively (cf. Table 5).
Fig. 2.
Comparison of the LSC, IR and SSC border regions among four cp genomes.
Fig. 3.
The events and the lengths of indel mutations in the CDS regions of cp genomes between Eletherococcus and Panax.
Fig. 4.
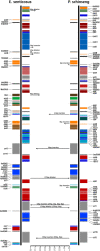
Small inversion mutations and associated secondary structures between the cp genomes of Eletherococcus (E) and the cp genome of Panax (P).
Fig. 5.
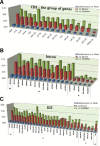
Comparisons of protein coding genes (CDS), introns, and intergenic spacers (IGS) of the chloroplast genomes in the three different comparisons of Eleutherococcus vs. Panax, Eleutherococcus vs. Daucus, and Eleutherococcus vs. Nicotiana. Y asis indicate the sequence divergences. For the CDS comparisons (top), 86 gene coding regions except trn genes are classified into 16 functional groups (Table 1) and their average sequence diversity is given in the figure. In the intron region comparisons (middle), the low levels of sequence divergences are distinct in the introns that are located on the IR regions. For the IGS region comparisons (bottom), the IGS between the 300 to 800 bp in length are summarized in this figure (
Supplementary datas 3–5
).
Fig. 6.
The levels of evolutionary divergences among the SSC, LSC, and IR regions of cp genomes. Y-axis represents the sequence divergences. The IR region evolves slower than the SSC or the LSC regions regardless the CDS, intron, and IGS.
Fig. 7.
Indel size and indel number distribution pattern among three cp genomes. The X-axis and Y-axis represent the indel size in base pair and indel numbers, respectively.
Similar articles
- Complete chloroplast DNA sequence from a Korean endemic genus, Megaleranthis saniculifolia, and its evolutionary implications.
Kim YK, Park CW, Kim KJ. Kim YK, et al. Mol Cells. 2009 Mar 31;27(3):365-81. doi: 10.1007/s10059-009-0047-6. Epub 2009 Mar 19. Mol Cells. 2009. PMID: 19326085 - The complete chloroplast genome of Eleutherococcus gracilistylus (W.W.Sm.) S.Y.Hu (Araliaceae).
Kim K, Lee J, Lee SC, Kim NH, Jang W, Kim S, Sung S, Lee J, Yang TJ. Kim K, et al. Mitochondrial DNA A DNA Mapp Seq Anal. 2016 Sep;27(5):3741-2. doi: 10.3109/19401736.2015.1079884. Epub 2015 Sep 10. Mitochondrial DNA A DNA Mapp Seq Anal. 2016. PMID: 26358682 - Complete chloroplast genome sequences of important oilseed crop Sesamum indicum L.
Yi DK, Kim KJ. Yi DK, et al. PLoS One. 2012;7(5):e35872. doi: 10.1371/journal.pone.0035872. Epub 2012 May 14. PLoS One. 2012. PMID: 22606240 Free PMC article.
Cited by
- Population identification and genetic diversity analysis of Fritillaria ussuriensis (Fritillaria) based on chloroplast genes atpF and petB.
Wang X, Zhang Z, Shi Y, Man J, Huang Y, Zhang X, Liu S, He G, An K, Amu L, Chen W, Liu Z, Wang X, Wei S. Wang X, et al. J Appl Genet. 2024 Sep;65(3):453-462. doi: 10.1007/s13353-024-00874-z. Epub 2024 Apr 29. J Appl Genet. 2024. PMID: 38684618 - Comparative analysis of medicinal plants Scutellaria baicalensis and common adulterants based on chloroplast genome sequencing.
Li Z, Duan B, Zhou Z, Fang H, Yang M, Xia C, Zhou Y, Wang J. Li Z, et al. BMC Genomics. 2024 Jan 8;25(1):39. doi: 10.1186/s12864-023-09920-2. BMC Genomics. 2024. PMID: 38191291 Free PMC article. - Complete Chloroplast Genome Sequence of the Endemic and Endangered Plant Dendropanax oligodontus: Genome Structure, Comparative and Phylogenetic Analysis.
Wang Y, Yu J, Chen YK, Wang ZC. Wang Y, et al. Genes (Basel). 2022 Nov 4;13(11):2028. doi: 10.3390/genes13112028. Genes (Basel). 2022. PMID: 36360265 Free PMC article. - Characterization and Comparative Analysis of Chloroplast Genomes in Five Uncaria Species Endemic to China.
Chen MM, Zhang M, Liang ZS, He QL. Chen MM, et al. Int J Mol Sci. 2022 Oct 1;23(19):11617. doi: 10.3390/ijms231911617. Int J Mol Sci. 2022. PMID: 36232915 Free PMC article. - Complete chloroplast genome sequence of Amomum villosum and comparative analysis with other Zingiberaceae plants.
Yang L, Feng C, Cai MM, Chen JH, Ding P. Yang L, et al. Chin Herb Med. 2020 Sep 16;12(4):375-383. doi: 10.1016/j.chmed.2020.05.008. eCollection 2020 Oct. Chin Herb Med. 2020. PMID: 36120171 Free PMC article.
References
- APG III. An update of the angiosperm phylogeny group classification for the orders and families of flowering plants. APG III. Bot. J. Linn. Soc. 2009;161:105–121.
- Bowman C.M., Dyer T.A. The location and possible evolutionary significance of small dispersed repeats in Wheat ctDNA. Curr. Genet. 1986;10:931–941.
- Bowman C.M., Barker R.F., Dyer T.A. In Wheat ctDNA, Segments of ribosomal-protein genes are dispersed repeats, probably conserved by nonreciprocal recombination. Curr. Genet. 1988;14:127–136. - PubMed
Publication types
MeSH terms
Substances
LinkOut - more resources
Full Text Sources
Molecular Biology Databases
Miscellaneous


