Plasminogen activator inhibitor-1 mitigates brain injury in a rat model of infection-sensitized neonatal hypoxia-ischemia - PubMed (original) (raw)
Plasminogen activator inhibitor-1 mitigates brain injury in a rat model of infection-sensitized neonatal hypoxia-ischemia
Dianer Yang et al. Cereb Cortex. 2013 May.
Abstract
Intrauterine infection exacerbates neonatal hypoxic-ischemic (HI) brain injury and impairs the development of cerebral cortex. Here we used low-dose lipopolysaccharide (LPS) pre-exposure followed by unilateral cerebral HI insult in 7-day-old rats to study the pathogenic mechanisms. We found that LPS pre-exposure blocked the HI-induced proteolytic activity of tissue-type plasminogen activator (tPA), but significantly enhanced NF-κB signaling, microglia activation, and the production of pro-inflammatory cytokines in newborn brains. Remarkably, these pathogenic responses were all blocked by intracerebroventricular injection of a stable-mutant form of plasminogen activator protein-1 called CPAI. Similarly, LPS pre-exposure amplified, while CPAI therapy mitigated HI-induced blood-brain-barrier damage and the brain tissue loss with a therapeutic window at 4 h after the LPS/HI insult. The CPAI also blocks microglia activation following a brain injection of LPS, which requires the contribution by tPA, but not the urinary-type plasminogen activator (uPA), as shown by experiments in tPA-null and uPA-null mice. These results implicate the nonproteolytic tPA activity in LPS/HI-induced brain damage and microglia activation. Finally, the CPAI treatment protects near-normal motor and white matter development despite neonatal LPS/HI insult. Together, because CPAI blocks both proteolytic and nonproteolytic tPA neurotoxicity, it is a promising therapeutics of neonatal HI injury either with or without infection.
Figures
Figure 1.
CPAI prevents LPS/HI-induced BBB damage in immature brains. (A) Representative photographs of the brains from P8 rat pups treated with the indicated conditions (A1–A5) 24 h earlier and injected intraperitoenally with NaF at 2 h prior to sacrifice and transcardial perfusion (n = 4–5 as indicated in B). (B) Quantification of the NaF fluorescence from brain extracts. LPS/HI insults increased the extravascular NaF fluorescence to 461 ± 26% (mean ± SEM) of the baseline level in the carotid-occluded hemisphere (HI, asterisk in A). L, the opposite (left) side of brain; R, the right side of brain. *P < 0.01 by unpaired _t_-test. (C) Representative MMP zymogram at 24 h after the indicated treatment conditions (n = 4). Equal loading of brain extracts was verified by the immunoblot detection of β-actin. The optic density of MMP-9 bands was quantified (lower panel). The _P_-value was determined using unpaired _t_-test. (D) Representative immunoblotting against ZO-1 at 24 h after the indicated treatments (n = 3). Quantification (lower panel) showed that LPS/HI insults reduced the ZO-1 level to 36 ± 13% (mean ± SEM) of the baseline level, while CPAI treatment prevented the decrease of ZO-1 (98 ± 2%). P < 0.05 by unpaired _t_-test. Note that LPS administration by itself had little effects, but its addition to HI amplified NaF extravasation, MMP-9 activation, and ZO-1 reduction, which were all markedly mitigated by post-LPS/HI administration of CPAI.
Figure 2.
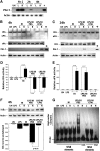
CPAI prevents LPS/HI-induced NF-κB signaling activation in immature brains. (A) Immunoblot analysis of the distribution and clearance of CPAI injected unilaterally to the lateral ventricle (arrow) in P7 rat pups. R, right hemisphere; L, left hemisphere. Note the undetectable basal level of PAI-1 in the brain parenchyma, diffusion of injected CPAI in both hemispheres, and a rapid decline of the CPAI level at 2 h post-intracerebrventricular (ICV) injection. (B and C) Representative photographs of plasminogen–zymogram and immunoblot-detection of tPA, PAI-1, or β-actin from brain extracts of rat pups at 4 (B) or (C) 24 h after the indicated conditions (n = 5). +, positive-control lanes were loaded with recombinant tPA or CPAI. The optic density of tPA band at 4 h and uPA band at 24 h was quantified for each condition for comparison (lower panel). Note the strong inhibition of tPA activity at 4 h in saline- or CPAI-treated brains following LPS/HI insult, as well as the induction of uPA activity at 24 h in both HI- and LPS/HI-challenged brains without the CPAI treatment. (F) Immunoblot detection of IκBα from whole-cell lysates of the brains collected at 4 h after the indicated conditions (n = 3). L, the opposite/left hemisphere. R, the carotid-occluded (right) hemisphere. Quantification after normalized to β-actin (lower panel) showed that LPS/HI decreased IκBα to 55 ± 4% (mean ± SEM) of the basal level in unchallenged brains, while post-HI administration of CPAI almost completely prevented IκBα reduction (96 ± 1% of the baseline); P < 0.01 by unpaired _t_-test. (_G_) Representative NF-κB EMSA gel using the nuclear extract of brains collected at 4 h after indicated conditions (_n_ > 6). Mut, oligonucleotide probes with mutated NF-κB binding sequence. Note that the high-order protein–DNA complex was detected only in the sample from LPS/HI-injured brains, which was abolished by the CPAI treatment.
Figure 3.
CPAI prevents LPS/HI-induced chemokine production and monocyte recruitment. (A) Representative results of a cytokine array using brain extracts at 24 h following indicated conditions (n = 2 for unchallenged and LPS-treated animals; n = 4 for LPS/HI-PBS or LPS/HI-CPAI treatments). The duplicated spots of MCP-1 and the quantification results were indicated. LPS/HI increased the brain MCP-1 level to 9.75 ± 0.54 (mean ± SD) fold of the baseline level, while CPAI treatment attenuated this induction. (B and C) ELISA analysis of the MCP-1 levels from brains (B) or the plasma (C) at 24 h after the indicated conditions (n = 4 for each). The MCP-1 level in the unchallenged brain was 4.4 ± 0.85 pg/mL extracts (mean ± SD), which was increased by LPS/HI insults to 50.3 ± 4.4 pg/mL (asterisk, P < 0.01) and significantly attenuated by the CPAI treatment (_P_ < 0.05 by unpaired _t_-test). In contrast, the basal plasma MCP-1 level was already high in unchallenged animals (116.7 ± 3.3 pg/mL), and upregulated by various stimuli to a similar degree. (_D_–_I_) Immunofluoresence detection of Iba1 (_D_, _E_, and _F_) and OX42/CD11b (_G_, _H_, and _I_) in coronal sections at the fornix-decussation level of brains collected at 16 h after pure-HI, LPS/HI-PBS, or LPS/HI-CPAI treatments (_n_> 5). White lines mark the boundaries of corpus callosum (CC). LV, lateral ventricles. Scale bar: 50 μm. Note that the CC in LPS/HI-PBS-treated rats was 2 times wider than that of LPS/HI-CPAI-treated rats and filled with numerous large, round Iba1/OX42 double-positive cells (248 ± 24 per visual field). In contrast, LPS/HI-CPAI-treated animals contained fewer Iba1+ cells within the corpus callosum (50 ± 11 per visual field) that exhibited ramified cytoplasmic processes and did not express OX42. Also note that the swelling of CC was milder in pure-HI-injured animal brains and there was no obvious OX42-immunoreactivity. (J) The tensor trace map from rat brain at 24 h after LPS/HI insult. Note the expansion/swelling of CC/external capsule on the HI-injured hemisphere (indicated by arrows).
Figure 4.
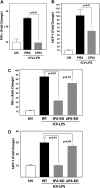
CPAI mitigates LPS-induced and tPA-dependent cytokine production. (A and B) ELISA measurement of the TNFα and MCP-1 level in the brains of P8 rats at 24 h after intracerebroventricular injection of 1.9 μg LPS, as well as saline (PBS) or 1.9 μg CPAI injection on the opposite cerebral ventricle, normalized to unchallenged (UN) animals (n = 4 for each group). Note that ICV injection of LPS increased both TNFα (172 ± 2%; mean ± SD) and MCP-1 (1026 ± 150%) levels in the brain, which were significantly attenuated by CPAI treatment (96 ± 2% for TNFα and 612 ± 145% for MCP-1, P < 0.01 by unpaired _t_-test). (C and D) ELISA measurement of the TNFα and MCP-1 level in the brains of P10 wild-type, _tPA_-null, and _uPA_-null mice at 24 h after ICV injection of 20 μg LPS (n = 5 for unchallenged and LPS injection groups of each genotype). An LPS injection increased both TNFα (834 ± 88%; mean ± SE) and MCP-1 levels (297 ± 36%) in wild-type mice, but only mildly affected the expression of TNFα (336 ± 78%) and MCP-1 (104 ± 2%) in _tPA_-null mice. The increase of TNFα (724 ± 51%) and MCP-1 (269 ± 15%) levels in _uPA_-null mice was not significantly different from that in wild-type mice.
Figure 5.
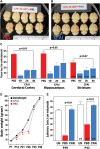
CPAI decreases LPS/HI-induced brain damage and impairment of motor functions. (A and B) Examples of the brains from rat pups receiving post-LPS/HI (10 min) ICV injection of saline (PBS, A) or 1.9 μg CPAI (B) at 7-day recovery. Note that the majority of saline-injected animals showed an obvious tissue loss on the right hemisphere (red arrows). (C) Quantification of tissue loss in the cerebral cortex, hippocampus, and striatum at 7 days after LPS/HI insult and ICV injection of saline (PBS) or 1.9 μg CPAI at 10 min, 2 h, or 4 h post-hypoxia. Shown are the percentages of tissue loss in each area to counterparts in contralateral hemisphere. With saline injection, there was a 43 ± 2.5% (mean ± SEM) tissue loss in the cerebral cortex, 44.2 ± 3.9% in the hippocampus, and 29.1 ± 3.3% in the striatum (n = 19). With CPAI injected at 10 min post-hypoxia (n = 20), the extent of tissue loss decreased to 4.7 ± 2.5% in the cerebral cortex, 9 ± 3.2% in the hippocampus, and 9.1 ± 2.8% in the striatum (n = 20). With CPAI injected at 2 h post-hypoxia, the tissue loss was 15 ± 2.6% in the cerebral cortex, 23.6 ± 4.6% in the hippocampus, and 9.1 ± 2.8% in the striatum (n = 17). With CPAI injection at 4 h post-hypoxia, the extent of tissue loss was 15.2 ± 4% in the cerebral cortex (P < 0.01 compared with saline injection by unpaired _t_-test), 28 ± 6.1% in the hippocampus (P < 0.05), and 9.1 ± 2.8% in the striatum (P = 0.07) (n = 18). (D) The body weight of unchallenged rat pups (n = 4) and those subjected to LPS/HI-insult at P7 followed by CPAI (n = 8) or saline (n = 9) treatment over 5-week recovery (P7–P42). Note that saline-treated rat pups initially gained body weight slower than unchallenged or CPAI-treated animals (asterisk: P < 0.05 by ANONA), but caught up in body weight after P28. (E) Comparison of the time (second) of staying on rotarods in unchallenged (UN, n = 4), LPS/HI-injured saline-injected (PBS, n = 9), and LPS/HI-injured CPAI-treated rat pups (CPAI, n = 8) when they reached 30 or 42 days of age. Note that the latency or falling from rotarods was significantly shorter in PBS-injected animals than that in CPAI-treated animals (P < 0.01 by unpaired _t_-test).
Figure 6.
CPAI protects WM development of after neonatal LPS/HI injury. (A) Representative coronal (upper row) and transverse (lower row) images of DEC map of the brains from unchallenged (UN, n = 2), LPS/HI-PBS- (n = 3), or LPS/HI-CPAI-treated rat pups (n = 3) at 2 months of age. The directions of color-encoded water diffusion along x, y, and z axes in coronal/transverse views were indicated, respectively. Note that the DEC maps in unchallenged or LPS/HI-CPAI animals were bilaterally symmetric, while major axonal tracts in LPS/HI-PBS animals, especially ec, ic, and the fm were truncated, misplaced, or decreased in mass. MoDG, molecular layer of the dentate gyrus; opt, optic tract. (B) Comparison of FA, axial/longitudinal diffusivity (λll), and radial/transverse diffusivity (λ┴) in the fm by ex vivo DTI of 2-month-old animals under indicated conditions. Shown are the ratios of individual DTI parameters in the hemisphere ipsilateral to carotid-occlusion (R) and that in the contralateral hemisphere (L). The R/L ratio of FA values in LPS/HI saline-injected rats was reduced to 70 ± 6.2% (mean ± SD), while that in LPS/HI CPAI-treated animals was 96 ± 4.4%. The R/L ratio of λ┴ values was 208.6 ± 41.8% in LPS/HI saline-injected rats, compared with 108 ± 25% in CPAI-treated animals. Asterisks: P < 0.05 by ANOVA. (C) Comparison of DTI parameters in the external and internal capsule of unchallenged and LPS/HI CPAI-treated rats at 2 months of age. The R/L ratio of each DTI parameters was close to 1 in unchallenged and CPAI-treated animals.
Figure 7.
Summary of how infection/LPS alters the pathogenic mechanisms of HI brain injury and how CPAI provides protection in both pure-HI and infection-sensitized HI insults through inhibition of tPA activities.
Similar articles
- Taming neonatal hypoxic-ischemic brain injury by intranasal delivery of plasminogen activator inhibitor-1.
Yang D, Sun YY, Lin X, Baumann JM, Warnock M, Lawrence DA, Kuan CY. Yang D, et al. Stroke. 2013 Sep;44(9):2623-2627. doi: 10.1161/STROKEAHA.113.001233. Epub 2013 Jul 23. Stroke. 2013. PMID: 23881953 Free PMC article. - Therapeutic administration of plasminogen activator inhibitor-1 prevents hypoxic-ischemic brain injury in newborns.
Yang D, Nemkul N, Shereen A, Jone A, Dunn RS, Lawrence DA, Lindquist D, Kuan CY. Yang D, et al. J Neurosci. 2009 Jul 8;29(27):8669-74. doi: 10.1523/JNEUROSCI.1117-09.2009. J Neurosci. 2009. PMID: 19587273 Free PMC article. - Deleterious effects of plasminogen activators in neonatal cerebral hypoxia-ischemia.
Adhami F, Yu D, Yin W, Schloemer A, Burns KA, Liao G, Degen JL, Chen J, Kuan CY. Adhami F, et al. Am J Pathol. 2008 Jun;172(6):1704-16. doi: 10.2353/ajpath.2008.070979. Epub 2008 May 8. Am J Pathol. 2008. PMID: 18467699 Free PMC article. - Anti-tissue plasminogen activator (tPA) as an effective therapy of neonatal hypoxia-ischemia with and without inflammation.
Yang D, Kuan CY. Yang D, et al. CNS Neurosci Ther. 2015 Apr;21(4):367-73. doi: 10.1111/cns.12365. Epub 2014 Dec 5. CNS Neurosci Ther. 2015. PMID: 25475942 Free PMC article. Review. - Hydrogen-rich saline promotes microglia M2 polarization and complement-mediated synapse loss to restore behavioral deficits following hypoxia-ischemic in neonatal mice via AMPK activation.
Chu X, Cao L, Yu Z, Xin D, Li T, Ma W, Zhou X, Chen W, Liu D, Wang Z. Chu X, et al. J Neuroinflammation. 2019 May 18;16(1):104. doi: 10.1186/s12974-019-1488-2. J Neuroinflammation. 2019. PMID: 31103039 Free PMC article. Review.
Cited by
- Innate immune regulation by toll-like receptors in the brain.
Mallard C. Mallard C. ISRN Neurol. 2012;2012:701950. doi: 10.5402/2012/701950. Epub 2012 Oct 14. ISRN Neurol. 2012. PMID: 23097717 Free PMC article. - Taming neonatal hypoxic-ischemic brain injury by intranasal delivery of plasminogen activator inhibitor-1.
Yang D, Sun YY, Lin X, Baumann JM, Warnock M, Lawrence DA, Kuan CY. Yang D, et al. Stroke. 2013 Sep;44(9):2623-2627. doi: 10.1161/STROKEAHA.113.001233. Epub 2013 Jul 23. Stroke. 2013. PMID: 23881953 Free PMC article. - Intranasal delivery of cell-penetrating anti-NF-κB peptides (Tat-NBD) alleviates infection-sensitized hypoxic-ischemic brain injury.
Yang D, Sun YY, Lin X, Baumann JM, Dunn RS, Lindquist DM, Kuan CY. Yang D, et al. Exp Neurol. 2013 Sep;247:447-455. doi: 10.1016/j.expneurol.2013.01.015. Epub 2013 Jan 23. Exp Neurol. 2013. PMID: 23353638 Free PMC article. - Hypoxia-Preconditioned Human Umbilical Vein Endothelial Cells Protect Against Neurovascular Damage After Hypoxic Ischemia in Neonatal Brain.
Lee YC, Chang YC, Wu CC, Huang CC. Lee YC, et al. Mol Neurobiol. 2018 Oct;55(10):7743-7757. doi: 10.1007/s12035-018-0867-5. Epub 2018 Feb 19. Mol Neurobiol. 2018. PMID: 29460267 - Current Therapies for Neonatal Hypoxic-Ischaemic and Infection-Sensitised Hypoxic-Ischaemic Brain Damage.
Tetorou K, Sisa C, Iqbal A, Dhillon K, Hristova M. Tetorou K, et al. Front Synaptic Neurosci. 2021 Aug 24;13:709301. doi: 10.3389/fnsyn.2021.709301. eCollection 2021. Front Synaptic Neurosci. 2021. PMID: 34504417 Free PMC article. Review.
References
- Adams-Chapman I, Stoll BJ. Neonatal infection and long-term neurodevelopmental outcome in the preterm infant. Curr Opin Infect Dis. 2006;19:290–297. doi:10.1097/01.qco.0000224825.57976.87. - DOI - PubMed
- Adhami F, Yu D, Yin W, Schloemer A, Burns KA, Liao G, Degen JL, Chen J, Kuan CY. Deleterious effects of plasminogen activators in neonatal cerebral hypoxia-ischemia. Am J Pathol. 2008;172:1704–1716. doi:10.2353/ajpath.2008.070979. - DOI - PMC - PubMed
- Allin MP, Kontis D, Walshe M, Wyatt J, Barker GJ, Kanaan RA, McGuire P, Rifkin L, Murray RM, Nosarti C. White matter and cognition in adults who were born preterm. PLoS One. 2011;6:e24525. doi:10.1371/journal.pone.0024525. - DOI - PMC - PubMed
- Beaulieu C. The basis of anisotropic water diffusion in the nervous system – a technical review. NMR Biomed. 2002;15:435–455. doi:10.1002/nbm.782. - DOI - PubMed
Publication types
MeSH terms
Substances
LinkOut - more resources
Full Text Sources
Molecular Biology Databases
Research Materials
Miscellaneous


