Selective pressure of antibiotic pollution on bacteria of importance to public health - PubMed (original) (raw)
Selective pressure of antibiotic pollution on bacteria of importance to public health
Alfredo Tello et al. Environ Health Perspect. 2012 Aug.
Abstract
Background: Many bacteria of clinical importance survive and may grow in different environments. Antibiotic pollution may exert on them a selective pressure leading to an increase in the prevalence of resistance.
Objectives: In this study we sought to determine whether environmental concentrations of antibiotics and concentrations representing action limits used in environmental risk assessment may exert a selective pressure on clinically relevant bacteria in the environment.
Methods: We used bacterial inhibition as an assessment end point to link antibiotic selective pressures to the prevalence of resistance in bacterial populations. Species sensitivity distributions were derived for three antibiotics by fitting log-logistic models to end points calculated from minimum inhibitory concentration (MIC) distributions based on worldwide data collated by the European Committee on Antimicrobial Susceptibility Testing (EUCAST). To place bacteria represented in these distributions in a broader context, we performed a brief phylogenetic analysis. The potentially affected fraction of bacterial genera at measured environmental concentrations of antibiotics and environmental risk assessment action limits was used as a proxy for antibiotic selective pressure. Measured environmental concentrations and environmental risk assessment action limits were also directly compared to wild-type cut-off values.
Results: The potentially affected fraction of bacterial genera estimated based on antibiotic concentrations measured in water environments is ≤ 7%. We estimated that measured environmental concentrations in river sediments, swine feces lagoons, liquid manure, and farmed soil inhibit wild-type populations in up to 60%, 92%, 100%, and 30% of bacterial genera, respectively. At concentrations used as action limits in environmental risk assessment, erythromycin and ciprofloxacin were estimated to inhibit wild-type populations in up to 25% and 76% of bacterial genera.
Conclusions: Measured environmental concentrations of antibiotics, as well as concentrations representing environmental risk assessment action limits, are high enough to exert a selective pressure on clinically relevant bacteria that may lead to an increase in the prevalence of resistance.
Conflict of interest statement
The authors declare they have no actual or potential competing financial interests.
Figures
Figure 1
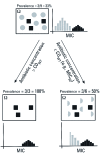
Conceptual link between the MIC50 and antibiotic concentrations > COWT with resistance prevalence in a universe (Ω) including resistant (black) and wild-type (gray) populations, and its relation to the MIC distribution. Antibiotic concentrations > COWT completely inhibit wild-types, and resistance prevalence in the active (i.e., growing) population will be 100%. Concentrations of antibiotics ≤ COWT, such as the MIC50, will inhibit a fraction of the wild-type population (e.g., 50%). If we assume equal growth rates of wild-type and resistant populations, the prevalence of antibiotic resistance will increase in the active population.
Figure 2
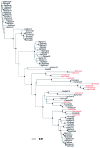
Unrooted neighbor-joining dendrogram of species (by LTP name) represented in the pooled 16S rRNA alignment of ciprofloxacin, erythromycin, and tetracycline. Species highlighted in red were not included in the species sensitivity distributions due to lack of evidence of growth in the environment. Bar units indicate the number of nucleotide substitutions per site. Black nodes indicate ≥ 70% bootstrap support; blue nodes indicate < 70% bootstrap support. Full species names are available in Supplemental Material, Table S1 (http://dx.doi.org/10.1289/ehp.1104650).
Figure 3
Histograms showing the range of pairwise evolutionary distances covered by (A) the pooled 16S rRNA alignment of species represented in the MIC distributions of all three antibiotics, and (B) the entire LTP 16S rRNA alignment for the domain Bacteria. Pairwise evolutionary distances in _A_were calculated from the same 16S rRNA alignment used to construct the dendrogram in Figure 2.
Figure 4
Species sensitivity distributions derived for the NOEC (black) and MIC50 (red) curves with overlayed empirical cumulative distributions (dots). Fitted curves represent the bootstrap estimate and 95% bootstrap CIs for the log-logistic model. Dashed and solid blue vertical lines represent the VICH phase I aquatic and soil action limits, respectively. (A) Ciprofloxacin: NOEC (_R_2 = 0.90; p < 0.0001), MIC50 (_R_2 = 0.91; p < 0.0001); bootstrap estimate of model parameters: NOEC species sensitivity distribution (α = –2.1, β = 0.37), MIC50 species sensitivity distribution (α = –1.0, β = 0.54). (B) Erythromycin: NOEC (_R_2 = 0.96; _p <_0.001), MIC50 (_R_2 = 0.97; p < 0.0001); bootstrap estimate of model parameters: NOEC species sensitivity distribution (α = –1.13, β = 0.29), MIC50 species sensitivity distribution (α = –0.014, β = 0.48). (C) Tetracycline: NOEC (_R_2 = 0.97; _p <_0.0001), MIC50 (_R_2 = 0.98; p < 0.0001); bootstrap estimate of model parameters: NOEC species sensitivity distribution (α = –0.84, β = 0.27), MIC50 species sensitivity distribution (α = 0.2, β = 0.33). The potentially affected fraction of bacterial genera at a given antibiotic concentration is read from the _y_-axis at the point in which the antibiotic concentration intersects with the species sensitivity distribution. For example, a concentration of 100 ppb (i.e., log10 concentration = 2) of ciprofloxacin inhibits approximately one-half of the wild-type population (i.e., red MIC50 curve) in 54% of the bacterial genera and at least some individuals (i.e., black NOEC curve) in 95% of the bacterial genera.
Figure 5
MICs ≥ COWT for bacterial taxa in the MIC distributions of ciprofloxacin (A), erythromycin (B), and tetracycline (C). Symbols represent the COWT for different genera; dashed vertical lines extend up to the maximum MIC beyond the COWT; and horizontal lines represent antibiotic concentrations. The _x_-axis represents the number of bacterial taxa with a defined COWT for each antibiotic, and the _y_-axis indicates antibiotic concentrations.
Comment in
- Preventing antibiotic resistance in the wild: a new end point for environmental risk assessment.
Barrett JR. Barrett JR. Environ Health Perspect. 2012 Aug;120(8):a321. doi: 10.1289/ehp.120-a321a. Environ Health Perspect. 2012. PMID: 22853922 Free PMC article. No abstract available.
Similar articles
- Concentrations of antibiotics predicted to select for resistant bacteria: Proposed limits for environmental regulation.
Bengtsson-Palme J, Larsson DG. Bengtsson-Palme J, et al. Environ Int. 2016 Jan;86:140-9. doi: 10.1016/j.envint.2015.10.015. Epub 2015 Nov 17. Environ Int. 2016. PMID: 26590482 - A probabilistic approach to assess antibiotic resistance development risks in environmental compartments and its application to an intensive aquaculture production scenario.
Rico A, Jacobs R, Van den Brink PJ, Tello A. Rico A, et al. Environ Pollut. 2017 Dec;231(Pt 1):918-928. doi: 10.1016/j.envpol.2017.08.079. Epub 2017 Sep 25. Environ Pollut. 2017. PMID: 28886537 - A survey of sub-inhibitory concentrations of antibiotics in the environment.
Chow LKM, Ghaly TM, Gillings MR. Chow LKM, et al. J Environ Sci (China). 2021 Jan;99:21-27. doi: 10.1016/j.jes.2020.05.030. Epub 2020 Jun 24. J Environ Sci (China). 2021. PMID: 33183698 Review. - Integrating human and environmental health in antibiotic risk assessment: A critical analysis of protection goals, species sensitivity and antimicrobial resistance.
Le Page G, Gunnarsson L, Snape J, Tyler CR. Le Page G, et al. Environ Int. 2017 Dec;109:155-169. doi: 10.1016/j.envint.2017.09.013. Epub 2017 Sep 28. Environ Int. 2017. PMID: 28964562 Review. - Comparative selective pressure potential of antibiotics in the environment.
Emara Y, Jolliet O, Finkbeiner M, Heß S, Kosnik M, Siegert MW, Fantke P. Emara Y, et al. Environ Pollut. 2023 Feb 1;318:120873. doi: 10.1016/j.envpol.2022.120873. Epub 2022 Dec 15. Environ Pollut. 2023. PMID: 36529346
Cited by
- One Health Implications of Antimicrobial Resistance in Bacteria from Amazon River Dolphins.
Rocha MFG, Diógenes EM, Carvalho VL, Marmontel M, da Costa MO, da Silva VMF, de Souza Amaral R, Gravena W, do Carmo NAS, Marigo J, Ocadaque CJ, Freitas AS, Pinheiro RM, de Lima-Neto RG, de Aguiar Cordeiro R, de Aquino Pereira-Neto W, de Melo Guedes GM, Sidrim JJC, de Souza Collares Maia Castelo-Branco D. Rocha MFG, et al. Ecohealth. 2021 Sep;18(3):383-396. doi: 10.1007/s10393-021-01558-4. Epub 2021 Oct 28. Ecohealth. 2021. PMID: 34709509 - [Sources and fate of pathogenic microorganisms in aquatic environments].
Baudart J, Paniel N. Baudart J, et al. Rev Francoph Lab. 2014 Feb;2014(459):29-39. doi: 10.1016/S1773-035X(14)72362-7. Epub 2014 Feb 18. Rev Francoph Lab. 2014. PMID: 32288818 Free PMC article. French. - Evaluation of Knowledge and Risk Perception about Antibiotic Resistance in Biology and Mathematics Young Students in Nîmes University in France.
Duvauchelle V, Causse E, Michon J, Rateau P, Weiss K, Meffre P, Benfodda Z. Duvauchelle V, et al. Int J Environ Res Public Health. 2021 Sep 14;18(18):9692. doi: 10.3390/ijerph18189692. Int J Environ Res Public Health. 2021. PMID: 34574614 Free PMC article. - Genetic and phenotypic evidence of the Salmonella enterica serotype Enteritidis human-animal interface in Chile.
Retamal P, Fresno M, Dougnac C, Gutierrez S, Gornall V, Vidal R, Vernal R, Pujol M, Barreto M, González-Acuña D, Abalos P. Retamal P, et al. Front Microbiol. 2015 May 15;6:464. doi: 10.3389/fmicb.2015.00464. eCollection 2015. Front Microbiol. 2015. PMID: 26029196 Free PMC article. - The use of minimum selectable concentrations (MSCs) for determining the selection of antimicrobial resistant bacteria.
Khan S, Beattie TK, Knapp CW. Khan S, et al. Ecotoxicology. 2017 Mar;26(2):283-292. doi: 10.1007/s10646-017-1762-y. Epub 2017 Feb 2. Ecotoxicology. 2017. PMID: 28155034 Free PMC article.
References
- Agersø Y, Wulff G, Vaclavik E, Halling-Sørensen B, Jensen LB. Effect of tetracycline residues in pig manure slurry on tetracycline-resistant bacteria and resistance gene tet(M) in soil microcosms. Environ Int. 2006;32:876–882. - PubMed
- Bonfiglio G, Livermore DM. Effect of media composition on the susceptibility of Xanthomonas mahophilia to β-lactam antibiotics. J Antimicrob Chemother. 1991;28:837–842. - PubMed
- Butler T, Frenck RW, Johnson RB, Khakhria R. In vitro effects of azithromycin on Salmonella typhi: early inhibition by concentrations less than the MIC and reduction of MIC by alkaline pH and small inocula. J Antimicrob Chemother. 2001;47:455–458. - PubMed
- Chander Y, Kumar K, Goyal SM, Gupta SC. Antibacterial activity of soil-bound antibiotics. J Environ Qual. 2005;34:1952–1957. - PubMed
Publication types
MeSH terms
Substances
LinkOut - more resources
Full Text Sources
Other Literature Sources


