DRP1-dependent mitochondrial fission initiates follicle cell differentiation during Drosophila oogenesis - PubMed (original) (raw)
DRP1-dependent mitochondrial fission initiates follicle cell differentiation during Drosophila oogenesis
Kasturi Mitra et al. J Cell Biol. 2012.
Abstract
Exit from the cell cycle is essential for cells to initiate a terminal differentiation program during development, but what controls this transition is incompletely understood. In this paper, we demonstrate a regulatory link between mitochondrial fission activity and cell cycle exit in follicle cell layer development during Drosophila melanogaster oogenesis. Posterior-localized clonal cells in the follicle cell layer of developing ovarioles with down-regulated expression of the major mitochondrial fission protein DRP1 had mitochondrial elements extensively fused instead of being dispersed. These cells did not exit the cell cycle. Instead, they excessively proliferated, failed to activate Notch for differentiation, and exhibited downstream developmental defects. Reintroduction of mitochondrial fission activity or inhibition of the mitochondrial fusion protein Marf-1 in posterior-localized DRP1-null clones reversed the block in Notch-dependent differentiation. When DRP1-driven mitochondrial fission activity was unopposed by fusion activity in Marf-1-depleted clones, premature cell differentiation of follicle cells occurred in mitotic stages. Thus, DRP1-dependent mitochondrial fission activity is a novel regulator of the onset of follicle cell differentiation during Drosophila oogenesis.
Figures
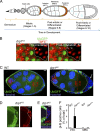
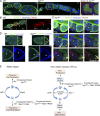
Figure 1.
DRP1 down-regulation inhibits mitochondrial fission and maintains proliferation in the postmitotic follicle cell layer. (A) Drosophila follicle cell lineage during different developmental stages of the ovariole. (B, left) Microirradiation of TMRE-labeled mitochondria in nonclonal (containing UbiGFP) and drp1KG clones (lacking UbiGFP) was performed at white points. (right) This caused rapid loss of all TMRE signal only in drp1KG clones (with clustered mitochondria) after irradiation (arrows point to the effect on TMRE signal). (C) drp1KG clonal follicle cells in a S8 egg chamber. Nonclonal cells express UbiGFP, whereas drp1KG clones lack UbiGFP. Red lines demarcate the boundary between patterned zones. The arrow points to proliferating drp1KG PFC clones. Hoechst (blue) stains nuclei. (D) drp1KG PFC clones (lacking UbiGFP) show BrdU incorporation in an S10 egg chamber. (E) drp1KG PFC clones (lacking UbiGFP) show pH3-positive cells. Hoechst stains nuclei. (F) Quantification of pH3-positive nuclei in background follicle cells versus drp1KG PFC and MBC clones in postmitotic egg chambers. Error bar indicates standard deviation. White lines define the clone boundary, and the dotted lines outline the egg chambers. WT, wild type. Bars, 10 µm.
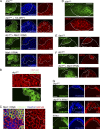
Figure 2.
DRP1 down-regulation inhibits Notch-driven differentiation of PFCs in a Marf-1–dependent manner. (A, top) S8 egg chamber with drp1KG PFC clones (CD8GFP label) do not express Hnt, whereas background PFCs (lacking the CD8GFP label) show Hnt labeling. (second row) drp1KG PFC clones (CD8GFP label) in constitutive HA-DRP1 background express Hnt. (third row) drp1KG + Marf-1 RNAi PFC clones (CD8GFP label) show patches of Hnt-positive cells. (bottom) Marf-1 RNAi clones alone (green) show Hnt labeling. Hoechst stains DNA. (B) Comparison of clustered mitochondrial phenotypes seen in drp1KG PFC clones (CD8GFP positive) with fragmented mitochondria (HSP-60) appearing in neighboring nonclonal cells in an S10 egg chamber. (C) Marf-1 RNAi expression (CD8GFP) causes clustered mitochondria (HSP-60) of MBCs in an S8 egg chamber to fragment. Hoechst stains nuclei. See
Fig. S1 E
for Marf-1 RNAi clones in S10 with the same phenotype. (D) drp1KG PFC clones (CD8GFP positive) show massive retention of NICD in the follicle cell plasma membrane of an S8 egg chamber. (E) drp1KG PFC clones (CD8GFP positive) show increased Cut labeling compared with the wild-type PFCs in the S8 egg chamber. (F) drp1KG + Marf-1 RNAi clones (bottom; CD8GFP positive) show significant loss of membrane NICD in the S8 egg chamber when compared with drp1KG clones (top). (G) PFC clones containing activated Notch (N-Act) and drp1KG in the S8 egg chamber (middle) show patches of Hnt-positive cells within the multilayer mass of follicle cells, suggesting that N-Act expression can partially override the block in differentiation (i.e., lack of Hnt) seen in drp1KG clones (top). (bottom) PFC clones expressing N-Act alone express Hnt and do not overproliferate. The white lines define the clone boundary, and the dotted lines outline the egg chambers. Bars, 10 µm.
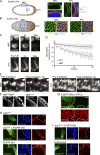
Figure 3.
Mitochondrial morphology differences in PFCs and MBCs established by EGFR signaling. (A and B, left) Sagittal view (A) and surface view (B) schematic of postmitotic wild-type egg chambers. Blue lines demarcate the boundary between PFC and MBC regions, and orange indicates patterning. (right) Enlarged areas correspond to the boxes in MBC and PFC regions. Low magnification images are shown in
Fig. S2 B
. Mitochondria were labeled by mito-GFP (A) or HSP-60 (B), nuclei was labeled with Hoechst, PKC marks apical membranes, and Discs large (Dlg) marks lateral membranes of the follicle cells. (C) Mitochondrial matrix continuity examined by a FLIP assay (see Materials and methods). MBCs or PFCs expressing mito-GFP (pre-FLIP image) were photobleached repeatedly in the white boxes and monitored for 200 s. Cell boundaries are shown in red. (D) Quantification of FLIP experiment. Total loss of fluorescence was quantified from eight MBCs and eight PFCs from four different egg chambers. Error bars signify standard deviation. (E) Microirradiation (green spots) of TMRE-labeled mitochondria in MBCs versus PFCs in the S8 egg chamber reveals faster loss of TMRE signal in MBCs. Cell boundaries are shown in red. (F) Down-regulation of EGFR in _egfr_t1/_egfr_t1 S8 egg chambers causes PFC mitochondrial clustering relative to that in _egfr_t1/+ chambers. Magnified regions from the boxes are shown on the right. (G) EGFR-DN PFC clones (marked by CD8GFP) in S8 chambers have more tightly clustered mitochondria (labeled with HSP-60) than in surrounding nonclonal cells. (H, middle) drp1KG + EGFR-DN PFC clones (CD8GFP label) show patches of Hnt-positive cells. (bottom) EGFR-DN clones alone (CD8GFP label) show Hnt labeling. Hoechst stains DNA. (I, top) drp1KG + EGFR-Act PFC clones (CD8GFP label) do not show patches of Hnt-positive cells. (bottom) EGFR-Act clones alone (CD8GFP label) show Hnt labeling. Hoechst stains DNA. The white lines define the clone boundary, and the dotted lines outline the egg chambers. a.u., arbitrary unit. Bars, 5 µm.
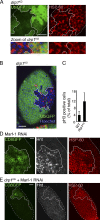
Figure 4.
DRP1 down-regulation inhibits cell cycle exit of mitotic follicle cells. (A) Mitochondria (HSP-60 labeled) are more clustered in clones of drp1KG (lacking UbiGFP) than in nonclonal cells in an S5 mitotic egg chamber. Bottom row shows magnification. Nuclei are stained with Hoechst. (B) Increased pH3 labeling occurs in drp1KG clones (lacking UbiGFP) in the S5 egg chamber. (C) Quantification of pH3-positive cells in drp1KG clones versus wild-type (WT) background in all mitotic stages. (D) Marf-1 RNAi clones (CD8GFP positive) have increased Hnt and HSP-60 immunolabeling relative to surrounding cells in an S5 mitotic egg chamber. (E) drp1KG clones expressing Marf-1 RNAi (CD8GFP positive) show no increase in Hnt or HSP-60 immunolabeling in an S3 mitotic egg chamber. The white lines define the clone boundary, and the dotted lines outline the egg chambers. Bars, 10 µm.
Figure 5.
DRP1 down-regulation causes developmental defects in ovarioles and model for mitochondria’s role in cell fate determination. (A) Down-regulating DRP1 inhibits stalk cell differentiation. Left image shows the wild-type (WT) ovariole. UbiGFP labels wild-type follicle cells, and Hoechst labels DNA. Stalk cells are indicated by arrowheads. Middle image shows ovarioles with drp1KG clones (lacking UbiGFP). Arrows indicate regions with no stalk cells. Right image shows presence of the mitotic marker pH3 label in drp1KG clonal cells in regions marked by arrows. The boxed region is zoomed in the right. (B) Wild-type egg chambers (with UbiGFP) show FasIII enrichment in polar cells at each termini (arrows) of the egg chamber. Hoechst stains nuclei. (C) Z sectioning through mitotic egg chambers immunostained for FasIII. Sections are arranged in a series, in which numbers represent optical sections from top to bottom. Wild-type chamber (with UbiGFP) has two FasIII-enriched polar cells (arrows in sections 1 and 9). Chamber (asterisks) primarily encapsulated by drp1KG clonal follicle cells (no UbiGFP) with only one polar cell pair (open arrow in section 4) and this wild-type FasIII-positive polar cell pair expresses UbiGFP and thus appears yellow. Hoechst stains the nuclei. (D, left) Oocyte nucleus (arrows) after normal migration to the anterior region of oocyte chamber in an S8 wild-type egg chamber. (right) Oocyte nucleus (arrows) in an S8 egg chamber containing drp1KG PFC clones (UbiGFP negative) fails to migrate to anterior. Hoechst labels all nuclei, including that of oocyte. Bottom images show magnification of white boxes. White lines define the clone boundary. (E) Model for role of mitochondrial dynamics in determining cell fate in mitotic and postmitotic stages of follicle cell development. Bars, 10 µm.
Similar articles
- ERK regulates mitochondrial membrane potential in fission deficient Drosophila follicle cells during differentiation.
Tomer D, Chippalkatti R, Mitra K, Rikhy R. Tomer D, et al. Dev Biol. 2018 Feb 1;434(1):48-62. doi: 10.1016/j.ydbio.2017.11.009. Epub 2017 Nov 20. Dev Biol. 2018. PMID: 29157562 - Mitochondrial fusion but not fission regulates larval growth and synaptic development through steroid hormone production.
Sandoval H, Yao CK, Chen K, Jaiswal M, Donti T, Lin YQ, Bayat V, Xiong B, Zhang K, David G, Charng WL, Yamamoto S, Duraine L, Graham BH, Bellen HJ. Sandoval H, et al. Elife. 2014 Oct 14;3:e03558. doi: 10.7554/eLife.03558. Elife. 2014. PMID: 25313867 Free PMC article. - At the crossroads of differentiation and proliferation: precise control of cell-cycle changes by multiple signaling pathways in Drosophila follicle cells.
Klusza S, Deng WM. Klusza S, et al. Bioessays. 2011 Feb;33(2):124-34. doi: 10.1002/bies.201000089. Bioessays. 2011. PMID: 21154780 Free PMC article. Review. - The coordinated regulation of mitochondrial structure and function by Drp1 for mitochondrial quality surveillance.
Cho HM, Sun W. Cho HM, et al. BMB Rep. 2019 Feb;52(2):109-110. doi: 10.5483/BMBRep.2019.52.2.032. BMB Rep. 2019. PMID: 30760382 Free PMC article. Review.
Cited by
- Mitochondrial morphology dynamics and ROS regulate apical polarity and differentiation in Drosophila follicle cells.
Uttekar B, Verma RK, Tomer D, Rikhy R. Uttekar B, et al. Development. 2024 Mar 1;151(5):dev201732. doi: 10.1242/dev.201732. Epub 2024 Feb 29. Development. 2024. PMID: 38345270 Free PMC article. - Significance of quantitative analyses of the impact of heterogeneity in mitochondrial content and shape on cell differentiation.
Agarwala S, Dhabal S, Mitra K. Agarwala S, et al. Open Biol. 2024 Jan;14(1):230279. doi: 10.1098/rsob.230279. Epub 2024 Jan 17. Open Biol. 2024. PMID: 38228170 Free PMC article. Review. - Study on the Key Genes and Molecular Mechanisms of IL-27 Promoting Keratinocytes Proliferation Based on Transcriptome Sequencing.
Wu Z, Yang Q, Xu K, Wu J, Yang B. Wu Z, et al. Clin Cosmet Investig Dermatol. 2023 Jun 7;16:1457-1472. doi: 10.2147/CCID.S414633. eCollection 2023. Clin Cosmet Investig Dermatol. 2023. PMID: 37309428 Free PMC article. - The mitochondrial ribosomal protein mRpL4 regulates Notch signaling.
Mo D, Liu C, Chen Y, Cheng X, Shen J, Zhao L, Zhang J. Mo D, et al. EMBO Rep. 2023 Jun 5;24(6):e55764. doi: 10.15252/embr.202255764. Epub 2023 Apr 3. EMBO Rep. 2023. PMID: 37009823 Free PMC article. - Mitochondria Lead the Way: Mitochondrial Dynamics and Function in Cellular Movements in Development and Disease.
Madan S, Uttekar B, Chowdhary S, Rikhy R. Madan S, et al. Front Cell Dev Biol. 2022 Feb 2;9:781933. doi: 10.3389/fcell.2021.781933. eCollection 2021. Front Cell Dev Biol. 2022. PMID: 35186947 Free PMC article. Review.
References
MeSH terms
Substances
LinkOut - more resources
Full Text Sources
Other Literature Sources
Molecular Biology Databases
Miscellaneous
