Biomarkers of mitochondrial content in skeletal muscle of healthy young human subjects - PubMed (original) (raw)
Biomarkers of mitochondrial content in skeletal muscle of healthy young human subjects
Steen Larsen et al. J Physiol. 2012.
Abstract
Skeletal muscle mitochondrial content varies extensively between human subjects. Biochemical measures of mitochondrial proteins, enzyme activities and lipids are often used as markers of mitochondrial content and muscle oxidative capacity (OXPHOS). The purpose of this study was to determine how closely associated these commonly used biochemical measures are to muscle mitochondrial content and OXPHOS. Sixteen young healthy male subjects were recruited for this study. Subjects completed a graded exercise test to determine maximal oxygen uptake (VO2peak) and muscle biopsies were obtained from the vastus lateralis. Mitochondrial content was determined using transmission electron microscopy imaging and OXPHOS was determined as the maximal coupled respiration in permeabilized fibres. Biomarkers of interest were citrate synthase (CS) activity, cardiolipin content, mitochondrial DNA content (mtDNA), complex I–V protein content, and complex I–IV activity. Spearman correlation coefficient tests and Lin's concordance tests were applied to assess the absolute and relative association between the markers and mitochondrial content or OXPHOS. Subjects had a large range of VO2peak (range 29.9–71.6ml min−1 kg−1) and mitochondrial content (4–15% of cell volume).Cardiolipin content showed the strongest association with mitochondrial content followed by CS and complex I activities. mtDNA was not related to mitochondrial content. Complex IV activity showed the strongest association with muscle oxidative capacity followed by complex II activity.We conclude that cardiolipin content, and CS and complex I activities are the biomarkers that exhibit the strongest association with mitochondrial content, while complex IV activity is strongly associated with OXPHOS capacity in human skeletal muscle.
Figures
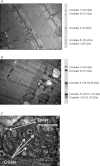
Figure 1. Representative electron microscopy images and western blots of complex I–V
Images and blots are from the two subjects with the lowest mitochondrial content (A) and second highest mitochondrial content (B). C, representative image used for measuring cristae surface area. A and B are ×20,000 magnification; scale bars are 1 μm. C is ×80,000 magnification and scale bar is 200 nm. Arrows shows examples of outer membrane and cristae.
Figure 2. Fibre respiration
Oxygen consumption (pmol s−1 (mg ww)−1) in permeabilized fibres. GM3: glutamate + malate + ADP-Mg; GM3u: glutamate + malate + ADP-Mg + FCCP; GMS3: glutamate + malate + ADP-Mg + succinate; GMS3u: glutamate + malate + ADP-Mg + succinate + FCCP; Oct3:
l
-malate + octanoyl-
l
-carnitine + ADP-Mg; Oct3u: malate + octanoyl-
l
-carnitine + ADP-Mg + FCCP; TMPD: ADP-Mg + cytochrome _c_+ antimycin A + ascorbate +_N,N,N_′,_N_′-tetramethyl-1,4-benzenediamine dihydrochloride; PGM3: pyruvate + malate + glutamate + ADP-Mg; PGMS3: pyruvate + glutamate + malate + ADP-Mg + succinate; PGMSOct3: pyruvate + glutamate + malate + ADP-Mg + succinate + octanoyl-
l
-carnitine. Numbers denote the statistical rank using one-way ANOVA with repeated measures, i.e. values denoted with the number 3 are significantly lower than values denoted with the number 2 and significantly higher than the values denoted with the number 4. *_P_= 0.06 compared with GM3u. Values are mean ± SEM.
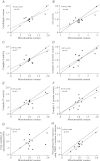
Figure 3. Correlation plots
Correlation between the relative variation of the mitochondrial content and the six biomarkers (A_–_F) of mitochondrial content that showed the highest Lin's concordance coefficient (_R_c) and two biomarkers of certain interest (G and H). TMPD + ascorbate are redox substrates feeding electrons directly to complex IV. Continuous lines represent the perfect linear fit (slope = 1) and dashed lines represent the actual linear fit. The linear fit was only shown when significance was present.
Comment in
- Skeletal muscle mitochondrial function: is it quality or quantity that makes the difference in insulin resistance?
Porter C, Wall BT. Porter C, et al. J Physiol. 2012 Dec 1;590(23):5935-6. doi: 10.1113/jphysiol.2012.241083. J Physiol. 2012. PMID: 23204102 Free PMC article. No abstract available.
Similar articles
- Invasive and noninvasive markers of human skeletal muscle mitochondrial function.
Mancilla R, Pava-Mejia D, van Polanen N, de Wit V, Bergman M, Grevendonk L, Jorgensen J, Kornips E, Hoeks J, Hesselink MKC, Schrauwen-Hinderling VB. Mancilla R, et al. Physiol Rep. 2023 Jun;11(12):e15734. doi: 10.14814/phy2.15734. Physiol Rep. 2023. PMID: 37340318 Free PMC article. - Simvastatin effects on skeletal muscle: relation to decreased mitochondrial function and glucose intolerance.
Larsen S, Stride N, Hey-Mogensen M, Hansen CN, Bang LE, Bundgaard H, Nielsen LB, Helge JW, Dela F. Larsen S, et al. J Am Coll Cardiol. 2013 Jan 8;61(1):44-53. doi: 10.1016/j.jacc.2012.09.036. J Am Coll Cardiol. 2013. PMID: 23287371 - Characteristics of skeletal muscle mitochondrial biogenesis induced by moderate-intensity exercise and weight loss in obesity.
Menshikova EV, Ritov VB, Ferrell RE, Azuma K, Goodpaster BH, Kelley DE. Menshikova EV, et al. J Appl Physiol (1985). 2007 Jul;103(1):21-7. doi: 10.1152/japplphysiol.01228.2006. Epub 2007 Mar 1. J Appl Physiol (1985). 2007. PMID: 17332268 Clinical Trial. - Capacity of oxidative phosphorylation in human skeletal muscle: new perspectives of mitochondrial physiology.
Gnaiger E. Gnaiger E. Int J Biochem Cell Biol. 2009 Oct;41(10):1837-45. doi: 10.1016/j.biocel.2009.03.013. Epub 2009 Apr 2. Int J Biochem Cell Biol. 2009. PMID: 19467914 Review. - A Scoping Review Investigating the "Gene-Dosage Theory" of Mitochondrial DNA in the Healthy Skeletal Muscle.
Pedersen ZO, Pedersen BS, Larsen S, Dysgaard T. Pedersen ZO, et al. Int J Mol Sci. 2023 May 2;24(9):8154. doi: 10.3390/ijms24098154. Int J Mol Sci. 2023. PMID: 37175862 Free PMC article.
Cited by
- Severe Burn Injury Induces Thermogenically Functional Mitochondria in Murine White Adipose Tissue.
Porter C, Herndon DN, Bhattarai N, Ogunbileje JO, Szczesny B, Szabo C, Toliver-Kinsky T, Sidossis LS. Porter C, et al. Shock. 2015 Sep;44(3):258-64. doi: 10.1097/SHK.0000000000000410. Shock. 2015. PMID: 26009824 Free PMC article. - Mitochondrial bioenergetic alterations after focal traumatic brain injury in the immature brain.
Kilbaugh TJ, Karlsson M, Byro M, Bebee A, Ralston J, Sullivan S, Duhaime AC, Hansson MJ, Elmér E, Margulies SS. Kilbaugh TJ, et al. Exp Neurol. 2015 Sep;271:136-44. doi: 10.1016/j.expneurol.2015.05.009. Epub 2015 May 28. Exp Neurol. 2015. PMID: 26028309 Free PMC article. - An evolving roadmap: using mitochondrial physiology to help guide conservation efforts.
Thoral E, Dawson NJ, Bettinazzi S, Rodríguez E. Thoral E, et al. Conserv Physiol. 2024 Sep 7;12(1):coae063. doi: 10.1093/conphys/coae063. eCollection 2024. Conserv Physiol. 2024. PMID: 39252884 Free PMC article. - NOX2 Inhibition Impairs Early Muscle Gene Expression Induced by a Single Exercise Bout.
Henríquez-Olguín C, Díaz-Vegas A, Utreras-Mendoza Y, Campos C, Arias-Calderón M, Llanos P, Contreras-Ferrat A, Espinosa A, Altamirano F, Jaimovich E, Valladares DM. Henríquez-Olguín C, et al. Front Physiol. 2016 Jul 14;7:282. doi: 10.3389/fphys.2016.00282. eCollection 2016. Front Physiol. 2016. PMID: 27471471 Free PMC article. - PGC-1α overexpression results in increased hepatic fatty acid oxidation with reduced triacylglycerol accumulation and secretion.
Morris EM, Meers GM, Booth FW, Fritsche KL, Hardin CD, Thyfault JP, Ibdah JA. Morris EM, et al. Am J Physiol Gastrointest Liver Physiol. 2012 Oct 15;303(8):G979-92. doi: 10.1152/ajpgi.00169.2012. Epub 2012 Aug 16. Am J Physiol Gastrointest Liver Physiol. 2012. PMID: 22899824 Free PMC article.
References
- Achten J, Gleeson M, Jeukendrup AE. Determination of the exercise intensity that elicits maximal fat oxidation. Med Sci Sports Exerc. 2002;34:92–97. - PubMed
- Andersen JL, Aagaard P. Myosin heavy chain IIX overshoot in human skeletal muscle. Muscle Nerve. 2000;23:1095–1104. - PubMed
- Anderson EJ, Boyle KE, Houmard JA, Neufer PD. Obesity is associated with reduced glutathione content, increased mitochondrial H2O2 emitting potential and a more oxidized redox environment in human skeletal muscle. Diabetes. 2008;57:A430–A430.
- Anderson EJ, Lustig ME, Boyle KE, Woodlief TL, Kane DA, Lin CT, Price JW, Kang L, Rabinovitch PS, Szeto HH, Houmard JA, Cortright RN, Wasserman DH, Neufer PD. Mitochondrial H2O2 emission and cellular redox state link excess fat intake to insulin resistance in both rodents and humans. J Clin Invest. 2009;119:573–581. - PMC - PubMed
Publication types
MeSH terms
Substances
LinkOut - more resources
Full Text Sources
Other Literature Sources
Miscellaneous


