Zbtb46 expression distinguishes classical dendritic cells and their committed progenitors from other immune lineages - PubMed (original) (raw)
Zbtb46 expression distinguishes classical dendritic cells and their committed progenitors from other immune lineages
Ansuman T Satpathy et al. J Exp Med. 2012.
Abstract
Distinguishing dendritic cells (DCs) from other cells of the mononuclear phagocyte system is complicated by the shared expression of cell surface markers such as CD11c. In this study, we identified Zbtb46 (BTBD4) as a transcription factor selectively expressed by classical DCs (cDCs) and their committed progenitors but not by plasmacytoid DCs (pDCs), monocytes, macrophages, or other lymphoid or myeloid lineages. Using homologous recombination, we replaced the first coding exon of Zbtb46 with GFP to inactivate the locus while allowing detection of Zbtb46 expression. GFP expression in Zbtb46(gfp/+) mice recapitulated the cDC-specific expression of the native locus, being restricted to cDC precursors (pre-cDCs) and lymphoid organ- and tissue-resident cDCs. GFP(+) pre-cDCs had restricted developmental potential, generating cDCs but not pDCs, monocytes, or macrophages. Outside the immune system, Zbtb46 was expressed in committed erythroid progenitors and endothelial cell populations. Zbtb46 overexpression in bone marrow progenitor cells inhibited granulocyte potential and promoted cDC development, and although cDCs developed in Zbtb46(gfp/gfp) (Zbtb46 deficient) mice, they maintained expression of granulocyte colony-stimulating factor and leukemia inhibitory factor receptors, which are normally down-regulated in cDCs. Thus, Zbtb46 may help enforce cDC identity by restricting responsiveness to non-DC growth factors and may serve as a useful marker to identify rare cDC progenitors and distinguish between cDCs and other mononuclear phagocyte lineages.
Figures
Figure 1.
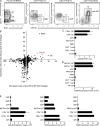
Zbtb46 is expressed in BM pre-cDCs and cDCs in both mouse and human. (A) BM cells from WT mice were stained for expression of the indicated markers. Two-color histograms are shown for live cells pregated as indicated above the diagram. Numbers represent the percentage of cells within the indicated gate. Data are representative of five independent experiments with at least two mice each. (B) Sorted populations in A were analyzed by gene expression microarray as described in Materials and methods. Gene expression levels were determined for a list of all transcription factors using dChip software (Li and Wong, 2001a,b) for the splenic pre-cDC, BM CDP, CD8α+ and CD4+ cDCs, and a broad panel of tissues (Lattin et al., 2008). For each transcription factor, the horizontal axis indicates the ratio of gene expression in the pre-cDC compared with the CDP, and the vertical axis indicates the ratio of the mean expression in CD8α+ and CD4+ DCs compared with the mean expression in the tissue panel excluding DCs. Each dot indicates an individual probe set. (C) Shown is the normalized expression value of Zbtb46 mRNA determined by quantitative RT-PCR for the indicated cell populations. Data represent three independently sorted replicates from three mice. (D) Shown is the expression value of BTBD4 mRNA in the indicated cells derived from Lindstedt et al. (2005) and Du et al. (2006). (E) Shown are the expression values for mouse Zbtb46, Irf8, and Batf3 mRNA transcripts in the indicated cell populations determined by expression microarray. Microarray analysis in B and E represents either two or three independently obtained arrays from progenitors sorted from three to five pooled WT mice. cDC arrays in E are derived from Robbins et al. (2008). (C–E) Bars represent the mean ± SEM.
Figure 2.
Generation of the Zbtb46gfp locus. (A) The endogenous mouse Zbtb46 locus (top) contains five exons, with the first exon entirely noncoding and the second exon containing the methionine initiation codon and encoding the BTB domain of Zbtb46 (line). The Zbtb46 locus, the targeting vector, and mutant allele with retention of the neomycin (pGK-Neo) selection cassette are shown. Exons are displayed as boxes, with coding regions shaded. Double digestion of the germline locus with KpnI (K) and BamHI (B) yields a restriction fragment of 13.8 kB, which is detected by both the 5′ probe and 3′ probe. Correctly targeted clones show an additional 7.3-kB band detected by the 5′ probe and a 6.2-kB band detected by the 3′ probe. Triangles indicate LoxP sequences. DTA, diphtheria toxin A; pA, polyadenylation signal; TK, thymidine kinase promoter. (B) Southern blot analysis of targeted clones. KpnI–BamHI double digests of clones 102, 136, and 137 were electrophoresed and hybridized with 5′ probe as previously described (Kohyama et al., 2009). (C) Southern blot analysis of tail DNA. Tail biopsies of germline-transmitted descendents of clone 102 obtained from breeding of heterozygous Zbtb46gfp/+ mice were double digested with KpnI and BamHI, electrophoresed, and hybridized with 5′ probe. Shown above the gel are the interpreted genotypes. (D) Splenic CD4+ cDCs and CD8α+ cDCs were isolated from Zbtb46+/+ (WT) and Zbtb46gfp/gfp (KO) mice, and gene expression microarray analysis was performed in comparison with WT CD4+ T cells. Shown is the expression value of the Zbtb46 probe set from the Affymetrix mouse Gene 1.0 array for the indicated cell types. Data are assembled from one to two replicate arrays obtained in one experiment.
Figure 3.
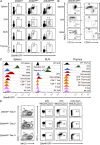
Zbtb46gfp specifically identifies cDCs in the mouse. Cells from Zbtb46+/+, Zbtb46gfp/+, and Zbtb46gfp/gfp were harvested from the spleen, SLNs, MLNs, and thymus as indicated and stained for CD11c, MHCII, CD172, CD24, and CD45. (A) Shown are two-color histograms for the indicated markers after gating for CD45 expression. Numbers represent the percentage of cells in the indicated gate. (B) Shown are two-color histograms for the indicated markers derived from a GFP+ gate as indicated in A from Zbtb46gfp/gfp mice. (C) Shown are single-color histograms for GFP expression of cells from Zbtb46+/+ mice (WT) or cells from Zbtb46gfp/+ mice stained to identify cDCs (MHCIIhiCD11chi), resident cDCs (MHCIIintCD11chi), migratory cDCs (MHCIIhiCD11cint/lo), pDCs (CD317+B220+), RPMs (F4/80+ autofluorescent), monocytes (CD11bhiCD11c−MHCII−Ly6G−), granulocytes (Ly6G+CD11b+), CD8+ T cells (CD8α+CD11c−), CD4+ T cells (CD4+CD11c−), B cells (B220+MHCII+), NK cells (NKp46+), DP thymocytes (CD4+CD8+Lin−), or DN thymocytes (CD4−CD8−Lin−). (D) BM cells from Zbtb46+/+ or Zbtb46gfp/+ mice were cultured with 100 ng/ml Flt3L for 6–9 d as indicated, harvested, and stained for CD11c, MHCII, and CD317. Gates identifying pDCs, cDCs, and precursors are indicated in two-color histograms for CD317 and MHCII expression on the left. Shown on the right are two-color histograms for CD11c and GFP expression for pDCs, cDCs, and precursor cells. All data in this figure are representative of three to five independent experiments using at least two mice per group.
Figure 4.
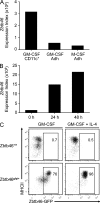
GM-CSF–derived cDCs express Zbtb46gfp. (A) BM cells from C57BL/6 mice were treated with 20 ng/ml GM-CSF or M-CSF, and cultures were harvested on day 7 and divided into adherent and nonadherent fractions. Nonadherent CD11c+ cDCs from the GM-CSF–treated cultures were purified by positive selection, and microarray analysis was performed on cDCs (GM-CSF CD11c+) and both adherent populations (Adh) for the indicated cultures. Shown is the expression value of the Zbtb46 probe set. (B) BM monocytes were purified by negative selection using antibodies for Ly6G, B220, CD4, CD8α, DX5, CD11c, Ter119, and CD117, resulting in a fraction of cells that were >90% pure for expression of CD11b and Ly6C. Cells were cultured with 20 ng/ml GM-CSF for the indicated number of hours and harvested, and microarray analysis was performed. Shown is the expression value of the Zbtb46 probe set. Data in A and B are from one experimental replicate obtained from cells pooled from three mice. (C) Monocytes were purified from BM by cell sorting as CD11b+Ly6C+Ly6G−CD11c−MHCII−Siglec-H− cells and cultured in 20 ng/ml GM-CSF with or without 20 ng/ml IL-4 as indicated and analyzed after 4 d for expression of Zbtb46gfp and MHCII. Data are representative of one experiment in which each sample was performed in triplicate. Numbers represent the percentage of cells in the indicated gate.
Figure 5.
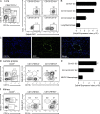
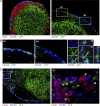
Zbtb46gfp distinguishes cDCs from macrophages in peripheral tissues. (A) Cells were harvested from perfused lungs of Zbtb46gfp/gfp mice and analyzed for expression of CD11c, MHCII, CD45, CD103, CD11b, GFP, and autofluorescence (centered on 700 nm). Shown (right) are two-color histograms for GFP expression and autofluorescence for the indicated populations. Numbers represent the percentage of cells in the indicated gate. Data are representative of three independent experiments with three mice per group. (B) Shown are the mean expression values of Zbtb46 (±SEM) determined by microarray for the indicated cell populations derived from the ImmGen Database (Heng and Painter, 2008). Data are assembled from two to four replicate arrays. (C) Lung sections from Zbtb46gfp/+ BM chimeras were stained for CD11b and anti-GFP. Data are representative of five independent experiments. Bars, 200 µm. (D) Cells were harvested from small intestinal lamina propria of Zbtb46gfp/+ mice and analyzed for expression of CD11c, MHCII, CD45, CD103, CD11b, and GFP. Shown (right) are two-color histograms for CD11b and GFP expression for the indicated populations. Data are representative of three independent experiments with two mice each. (E) Shown are the mean expression values of Zbtb46 (±SEM) in the indicated cells derived from Heng and Painter (2008). Data are assembled from four to seven replicate arrays. (F) Cells harvested from the kidney from Zbtb46gfp/gfp mice were stained as in D. Data are representative of three independent experiments with two mice each.
Figure 6.
Zbtb46gfp is expressed in CX3CR1+CD8α+, LPS-induced, and CD169+ DCs. (A) Shown are single-color histograms of GFP expression from Zbtb46+/+ mice (WT) or Zbtb46gfp/+ mice and stained to identify cDCs (MHCIIhiCD11chi), CX3CR1+CD8α+ DCs (CD8α+MHCII+CD11chiDEC205−), LPS-DCs (MHCIIhiCD11b+CD206+), CD11chiCD169+ cells, CD11cintCD169+ cells, or Tip-DCs (CD11cintCD11bhiLy6C+) according to the gating strategies shown in B–E. Data are representative of one to three independent experiments with at least three mice per group. (B) Splenocytes from Zbtb46+/+ and Zbtb46gfp/+ mice were stained for expression of the indicated markers. Cells within the indicated gate of the far left panel were analyzed for expression of DEC205 and CD86 (middle left), and DEC205 and Zbtb46gfp (right panels) for either Zbtb46+/+ or Zbtb46gfp/+ mice. Data are representative of three independent experiments with three mice each. Numbers represent the percentage of cells in the indicated gate. (C) SLNs from Zbtb46+/+ and Zbtb46gfp/gfp mice treated i.v. with either PBS or 5 µg LPS were analyzed after 18 h for expression of the indicated markers for cells previously gated as indicated above the histogram. Data are representative of two independent experiments involving three mice per group. (D) Cells from MLNs of Zbtb46gfp/+ mice were analyzed for expression of the indicated markers on cells previously gated as indicated above the histogram. Data are representative of three independent experiments with three mice per group. (E) Splenocytes from Zbtb46gfp/gfp mice infected with L. monocytogenes for 2 d were analyzed for expression of CD11b and CD11c (left) and gates established for monocytes, Tip-DCs, and cDCs. Cells within each gate were analyzed for expression of Ly6C and CD317.
Figure 7.
Zbtb46gfp is expressed in a subset of CD169+ subcapsular cells but not in medullary macrophages. (A) SLN sections from Zbtb46gfp/+ → WT BM chimeras were analyzed by fluorescence microscopy for expression of B220, CD169, and GFP. (B) Areas B1 and B2 from A (right) are shown at higher magnification as indicated (first and second panels). Confocal images along three planes (x, y, and z; right) confirm GFP expression within CD169+ cells. (C) MLN sections from Zbtb46gfp/+ → WT BM chimeras were analyzed for expression of F4/80, CD169, and GFP. The area indicated as C1 (left) is shown at higher magnification (right) to demonstrate that medullary macrophages are negative for GFP expression (arrows). Immunofluorescence images are representative of three to four independent experiments with one or two mice each. Confocal images are representative of one independent experiment in which three individual mice were analyzed. Bars: (A and C [left]) 200 µm; (B [left and middle] and C [right]) 50 µm; (B, right) 10 µm.
Figure 8.
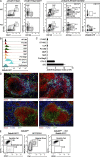
Zbtb46 is expressed in definitive erythroid precursors and endothelial cells. (A) BM cells from Zbtb46+/+ (WT) or Zbtb46gfp/gfp (KO) mice were stained for expression of lineage markers B220, NKp461, and CD3 (Lin), Sca-1, CD16/32, CD41, CD105, CD117, CD135, and CD150 and analyzed using a FACSAria. Shown are two-color histograms for the indicated markers on cells previously gated for expression as indicated above the diagram. Numbers represent the percentage of cells within the indicated gate. The gates used to identify MkP, GMP, CMP, CDP, CFU-E, pre–CFU-E, pre-MegE, and pre-GM populations for later GFP expression analysis are indicated. Data are representative of five independent experiments with at least two mice per group. (B) Shown are single-color histograms for GFP expression of cells stained in A for each indicated gate. (C) Shown are mean expression values of Zbtb46 (±SEM) for each indicated cell population derived from Pronk et al. (2007). Data are assembled from two to four replicate arrays. (D) Spleen sections from Zbtb46gfp/+ (left) or Zbtb46gfp/+ → WT BM chimera (right) mice were stained for CD11c, B220, F4/80, and GFP. Arrows indicate GFP+CD11c− endothelial cells. Data are representative of three independent experiments with one or two mice per group. Bars, 200 µm. (E) Splenocytes were stained for expression of CD11c, CD31, MADCAM-1, and Flk1. Shown are two-color histograms of cells from Zbtb46gfp/+ (left and middle) or a Zbtb46gfp/+ → WT BM chimera (right) for the indicated markers of cells previously gated as indicated above the diagram. Gates are labeled by cellular identity. Data are representative of three independent experiments with one or two mice each.
Figure 9.
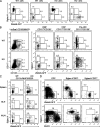
Zbtb46 expression identifies committed pre-cDCs in BM and peripheral lymphoid tissues. (A) BM from Zbtb46+/+ (WT) and Zbtb46gfp/gfp (KO) mice was stained for expression of Siglec-H, CD317, B220, CD11c, and MHCII. Shown are two-color histograms for Siglec-H and GFP expression for cells previously gated for positive expression of B220, CD317, and Siglec-H (pDC) or for positive expression of CD11c and MHCII (cDC) as indicated above the diagram. Numbers represent the percentage of cells within the indicated gate. Data are representative of three independent experiments with three mice each. (B) BM cells from Zbtb46+/+ (WT) and Zbtb46gfp/gfp (KO) mice were stained for expression of B220 and NKp46 (Lin), Sca-1, CD105, MHCII, CD117, CD135, CD11c, and Siglec-H. Shown are two-color histograms for expression of the indicated markers for cells previously gated as indicated above the diagram. Data are representative of five independent experiments with two mice each. (C) Splenocytes, SLNs, and MLNs from Zbtb46+/+ (WT) and Zbtb46gfp/gfp (KO) mice were analyzed for expression of CD11c, MHCII, B220, Siglec-H, and GFP. Shown are histograms depicting Siglec-H and GFP expression for cells previously gated as indicated above the diagram. Data are representative of two independent experiments with one or two mice each. (D) BM cells from Zbtb46gfp/gfp mice were sorted into populations of Lin−Sca-1−CD105−CD117intCD135+MHCII− (CDP; left), Lin−Sca-1−CD105−MHCII−CD117loCD135+Siglec-H+GFP− (Siglec-H+GFP−; middle), or Lin−Sca-1−CD105−MHCII−CD117loCD135+Siglec-H+ and GFP+ (Siglec-H+GFP+; right) as indicated above the diagram. Cells were cultured in 100 ng/ml Flt3L for 4 d and analyzed by FACS for expression of Siglec-H, GFP, and MHCII. Data are representative of three independent experiments with two to three mice each.
Figure 10.
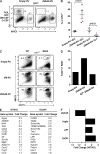
Zbtb46 inhibits granulocyte potential, enhances cDC development, and regulates expression of non-DC growth factor receptors. (A) GFP-RV (Empty-RV; Ranganath et al., 1998) or a retrovirus encoding mouse Zbtb46 (Zbtb46-RV) was used to infect BM cells and cultured with growth factors as described in Materials and methods. On day 5, cells were harvested and analyzed for expression of Gr1, MHCII, and GFP. Shown are two-color histograms for the retroviral constructs indicated above the diagram for the indicated markers for cells gated on positive expression of GFP (GFP+). Numbers represent the percentage of cells in the indicated gates. Data are representative of three independent experiments using at least two mice per group. (B) Replicates from two experiments (each experiment is uniquely colored) described in A are shown. Numbers represent the percentage of cells on day 5 that are present within the gates for cDCs or granulocytes (Gr1+) as indicated below the diagram. Bars represent the mean ± SEM. (C) BM from WT or BXH2 recombinant inbred mice (Tailor et al., 2008) was infected with GFP-RV, a retrovirus encoding full-length mouse Irf8 (Irf8-RV) or Zbtb46-RV as described in A and analyzed on day 5 for expression of CD11c and MHCII. Similar diminishment of cDC development was seen with Irf8−/− BM, which was similarly restored by Zbtb46-RV (not depicted). Data are representative of two independent experiments with two mice per group. (D) GFP-RV vector (Empty-RV) or retroviruses expressing full-length Zbtb46 (Zbtb46-RV) or a truncated Zbtb46 in which the region of cDNA encoding the C-terminal zinc finger domains (amino acids 404–601) were removed (dZF-Zbtb46-RV) and were used to infect BM progenitors as described in A, and cells were transferred into sublethally irradiated CD45.1 recipients. After 14 d, splenocytes were harvested from recipient mice, and CD45.2+GFP+ cells were analyzed for expression of CD11c, B220, and MHCII. Shown are the percentage of cells within the B220−CD11c+ gate for cells previously gated as CD45.2+GFP+ for the indicated retroviral construct. Data are representative of three independent experiments with one mouse per group. (E) Sorted steady-state splenic CD172+CD4+ cDCs from Zbtb46+/+ (WT) and Zbtb46gfp/gfp (KO) mice were purified, and gene expression microarrays were performed. Genes that are increased in the WT sample relative to the Zbtb46gfp/gfp (KO) sample (left) are listed with the associated fold induction. Genes that are increased in Zbtb46gfp/gfp (KO) mice relative to WT are listed with their fold induction (right). (F) Fold changes of the indicated genes derived from E are shown for their expression in WT compared with Zbtb46gfp/gfp (KO) mice.
Similar articles
- Expression of the zinc finger transcription factor zDC (Zbtb46, Btbd4) defines the classical dendritic cell lineage.
Meredith MM, Liu K, Darrasse-Jeze G, Kamphorst AO, Schreiber HA, Guermonprez P, Idoyaga J, Cheong C, Yao KH, Niec RE, Nussenzweig MC. Meredith MM, et al. J Exp Med. 2012 Jun 4;209(6):1153-65. doi: 10.1084/jem.20112675. Epub 2012 May 21. J Exp Med. 2012. PMID: 22615130 Free PMC article. - Lymphoid tissue and plasmacytoid dendritic cells and macrophages do not share a common macrophage-dendritic cell-restricted progenitor.
Sathe P, Metcalf D, Vremec D, Naik SH, Langdon WY, Huntington ND, Wu L, Shortman K. Sathe P, et al. Immunity. 2014 Jul 17;41(1):104-15. doi: 10.1016/j.immuni.2014.05.020. Immunity. 2014. PMID: 25035955 - Classical dendritic cells as a unique immune cell lineage.
Reizis B. Reizis B. J Exp Med. 2012 Jun 4;209(6):1053-6. doi: 10.1084/jem.20121038. J Exp Med. 2012. PMID: 22665701 Free PMC article. Review. - In vivo analysis of dendritic cell development and homeostasis.
Liu K, Victora GD, Schwickert TA, Guermonprez P, Meredith MM, Yao K, Chu FF, Randolph GJ, Rudensky AY, Nussenzweig M. Liu K, et al. Science. 2009 Apr 17;324(5925):392-7. doi: 10.1126/science.1170540. Epub 2009 Mar 12. Science. 2009. PMID: 19286519 Free PMC article. - Origin and development of classical dendritic cells.
Guermonprez P, Gerber-Ferder Y, Vaivode K, Bourdely P, Helft J. Guermonprez P, et al. Int Rev Cell Mol Biol. 2019;349:1-54. doi: 10.1016/bs.ircmb.2019.08.002. Epub 2019 Nov 8. Int Rev Cell Mol Biol. 2019. PMID: 31759429 Review.
Cited by
- Tissue-Specific Immune Transcriptional Signatures in the Bordering Tissues of the Mouse Retina and Brain.
Etebar F, Whatmore P, Harkin DG, Dando SJ. Etebar F, et al. Invest Ophthalmol Vis Sci. 2024 Oct 1;65(12):42. doi: 10.1167/iovs.65.12.42. Invest Ophthalmol Vis Sci. 2024. PMID: 39466230 Free PMC article. - Type 17 immunity: novel insights into intestinal homeostasis and autoimmune pathogenesis driven by gut-primed T cells.
Ohara D, Takeuchi Y, Hirota K. Ohara D, et al. Cell Mol Immunol. 2024 Nov;21(11):1183-1200. doi: 10.1038/s41423-024-01218-x. Epub 2024 Oct 8. Cell Mol Immunol. 2024. PMID: 39379604 Free PMC article. Review. - Craters on the melanoma surface facilitate tumor-immune interactions and demonstrate pathologic response to checkpoint blockade in humans.
Ludin A, Stirtz GL, Tal A, Nirmal AJ, Besson N, Jones SM, Pfaff KL, Manos M, Liu S, Barrera I, Gong Q, Rodrigues CP, Sahu A, Jerison E, Alessi JV, Ricciuti B, Richardson DS, Weiss JD, Moreau HM, Stanhope ME, Afeyan AB, Sefton J, McCall WD, Formato E, Yang S, Zhou Y, van Konijnenburg DPH, Cole HL, Cordova M, Deng L, Rajadhyaksha M, Quake SR, Awad MM, Chen F, Sorger PK, Hodi FS, Rodig SJ, Murphy GF, Zon LI. Ludin A, et al. bioRxiv [Preprint]. 2024 Sep 19:2024.09.18.613595. doi: 10.1101/2024.09.18.613595. bioRxiv. 2024. PMID: 39345527 Free PMC article. Preprint. - Evaluating in vivo approaches for studying the roles of thymic DCs in T cell development in mice.
Wang Y, Chong MMW. Wang Y, et al. Front Immunol. 2024 Aug 6;15:1451974. doi: 10.3389/fimmu.2024.1451974. eCollection 2024. Front Immunol. 2024. PMID: 39165362 Free PMC article. Review. - ZBTB46 coordinates angiogenesis and immunity to control tumor outcome.
Kabir AU, Zeng C, Subramanian M, Wu J, Kim M, Krchma K, Wang X, Halabi CM, Pan H, Wickline SA, Fremont DH, Artyomov MN, Choi K. Kabir AU, et al. Nat Immunol. 2024 Sep;25(9):1546-1554. doi: 10.1038/s41590-024-01936-4. Epub 2024 Aug 12. Nat Immunol. 2024. PMID: 39134750
References
- Bar-On L., Birnberg T., Lewis K.L., Edelson B.T., Bruder D., Hildner K., Buer J., Murphy K.M., Reizis B., Jung S. 2010. CX3CR1+ CD8alpha+ dendritic cells are a steady-state population related to plasmacytoid dendritic cells. Proc. Natl. Acad. Sci. USA. 107:14745–14750 10.1073/pnas.1001562107 - DOI - PMC - PubMed
Publication types
MeSH terms
Substances
Grants and funding
- HHMI/Howard Hughes Medical Institute/United States
- P30 CA91842/CA/NCI NIH HHS/United States
- T32 AI007163/AI/NIAID NIH HHS/United States
- P30 CA091842/CA/NCI NIH HHS/United States
- P30 DK020579/DK/NIDDK NIH HHS/United States
- AI076427-02/AI/NIAID NIH HHS/United States
- R01 AI076427/AI/NIAID NIH HHS/United States
LinkOut - more resources
Full Text Sources
Other Literature Sources
Molecular Biology Databases
Research Materials
