A genome-wide association study reveals loci influencing height and other conformation traits in horses - PubMed (original) (raw)
A genome-wide association study reveals loci influencing height and other conformation traits in horses
Heidi Signer-Hasler et al. PLoS One. 2012.
Abstract
The molecular analysis of genes influencing human height has been notoriously difficult. Genome-wide association studies (GWAS) for height in humans based on tens of thousands to hundreds of thousands of samples so far revealed ∼200 loci for human height explaining only 20% of the heritability. In domestic animals isolated populations with a greatly reduced genetic heterogeneity facilitate a more efficient analysis of complex traits. We performed a genome-wide association study on 1,077 Franches-Montagnes (FM) horses using ∼40,000 SNPs. Our study revealed two QTL for height at withers on chromosomes 3 and 9. The association signal on chromosome 3 is close to the LCORL/NCAPG genes. The association signal on chromosome 9 is close to the ZFAT gene. Both loci have already been shown to influence height in humans. Interestingly, there are very large intergenic regions at the association signals. The two detected QTL together explain ∼18.2% of the heritable variation of height in horses. However, another large fraction of the variance for height in horses results from ECA 1 (11.0%), although the association analysis did not reveal significantly associated SNPs on this chromosome. The QTL region on ECA 3 associated with height at withers was also significantly associated with wither height, conformation of legs, ventral border of mandible, correctness of gaits, and expression of the head. The region on ECA 9 associated with height at withers was also associated with wither height, length of croup and length of back. In addition to these two QTL regions on ECA 3 and ECA 9 we detected another QTL on ECA 6 for correctness of gaits. Our study highlights the value of domestic animal populations for the genetic analysis of complex traits.
Conflict of interest statement
Competing Interests: The authors have declared that no competing interests exist.
Figures
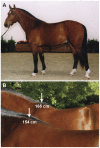
Figure 1. The Franches-Montagnes horse belongs to the type of light draft horse breeds and has its origins in Switzerland (A).
Height at withers is one of 28 conformation traits, for which breeding values are estimated once a year (B). The breed standard calls for horses between 150–160 cm in size. The stallion in the background was the tallest horse in our study with a phenotypic height at withers of 165 cm. (Picture: Swiss National Stud Farm).
Figure 2. Manhattan plot for height at withers based on dEBV.
The red line indicates the Bonferroni-corrected significance level (p<1.31×10⁻⁶). The inset shows a quantile-quantile (qq) plot with the observed plotted against the expected p-values. The used mixed-model approach efficiently corrected for the stratification in the sample. The skew at the right edge indicates that these SNPs are stronger associated with height than would be expected by chance. This is consistent with a true association as opposed to a false positive signal due to population stratification.
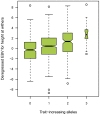
Figure 3. Combined effect size of the two identified QTL on ECA 3 and ECA 9 on the dEBV for height at withers in the FM horse breed.
The box plot indicates the median values, 25% and 75% quartiles and the outliers of the distribution. A total of 308, 513, 211, and 21 animals, respectively, represented the classes from zero to three trait-increasing alleles. The difference in the medians between horses with zero and three trait-increasing alleles, respectively, is 2.97 cm. None of the analyzed horses carried four trait-increasing alleles. The association between the number of trait increasing alleles and height at withers is highly significant (p = 8.4×10⁻¹³; Kruskal-Wallis test). Medians are significantly different between groups.
Figure 4. Estimates of height at withers dEBV variance explained by SNPs on 31 autosomes (black bars) and the two identified QTL (green bars).
The two QTL combined explain 18.2% of the variance. All chromosomes together explain 70.2% of the genetic variance.
Similar articles
- Genomic analyses of withers height and linear conformation traits in German Warmblood horses using imputed sequence-level genotypes.
Reich P, Möller S, Stock KF, Nolte W, von Depka Prondzinski M, Reents R, Kalm E, Kühn C, Thaller G, Falker-Gieske C, Tetens J. Reich P, et al. Genet Sel Evol. 2024 Jun 13;56(1):45. doi: 10.1186/s12711-024-00914-6. Genet Sel Evol. 2024. PMID: 38872118 Free PMC article. - A genome-wide association study indicates LCORL/NCAPG as a candidate locus for withers height in German Warmblood horses.
Tetens J, Widmann P, Kühn C, Thaller G. Tetens J, et al. Anim Genet. 2013 Aug;44(4):467-71. doi: 10.1111/age.12031. Epub 2013 Feb 18. Anim Genet. 2013. PMID: 23418885 - A QTL for conformation of back and croup influences lateral gait quality in Icelandic horses.
Rosengren MK, Sigurðardóttir H, Eriksson S, Naboulsi R, Jouni A, Novoa-Bravo M, Albertsdóttir E, Kristjánsson Þ, Rhodin M, Viklund Å, Velie BD, Negro JJ, Solé M, Lindgren G. Rosengren MK, et al. BMC Genomics. 2021 Apr 14;22(1):267. doi: 10.1186/s12864-021-07454-z. BMC Genomics. 2021. PMID: 33853519 Free PMC article. - Genome-wide association studies based on sequence-derived genotypes reveal new QTL associated with conformation and performance traits in the Franches-Montagnes horse breed.
Frischknecht M, Signer-Hasler H, Leeb T, Rieder S, Neuditschko M. Frischknecht M, et al. Anim Genet. 2016 Apr;47(2):227-9. doi: 10.1111/age.12406. Epub 2016 Jan 14. Anim Genet. 2016. PMID: 26767322 - Genetic and genomic characterization followed by single-step genomic evaluation of withers height in German Warmblood horses.
Vosgerau S, Krattenmacher N, Falker-Gieske C, Seidel A, Tetens J, Stock KF, Nolte W, Wobbe M, Blaj I, Reents R, Kühn C, von Depka Prondzinski M, Kalm E, Thaller G. Vosgerau S, et al. J Appl Genet. 2022 May;63(2):369-378. doi: 10.1007/s13353-021-00681-w. Epub 2022 Jan 14. J Appl Genet. 2022. PMID: 35028913 Free PMC article.
Cited by
- Sequenced-based GWAS for linear classification traits in Belgian Blue beef cattle reveals new coding variants in genes regulating body size in mammals.
Gualdrón Duarte JL, Yuan C, Gori AS, Moreira GCM, Takeda H, Coppieters W, Charlier C, Georges M, Druet T. Gualdrón Duarte JL, et al. Genet Sel Evol. 2023 Nov 28;55(1):83. doi: 10.1186/s12711-023-00857-4. Genet Sel Evol. 2023. PMID: 38017417 Free PMC article. - Genome-wide association study of body weight in Australian Merino sheep reveals an orthologous region on OAR6 to human and bovine genomic regions affecting height and weight.
Al-Mamun HA, Kwan P, Clark SA, Ferdosi MH, Tellam R, Gondro C. Al-Mamun HA, et al. Genet Sel Evol. 2015 Aug 14;47(1):66. doi: 10.1186/s12711-015-0142-4. Genet Sel Evol. 2015. PMID: 26272623 Free PMC article. - Insight into the Candidate Genes and Enriched Pathways Associated with Height, Length, Length to Height Ratio and Body-Weight of Korean Indigenous Breed, Jindo Dog Using Gene Set Enrichment-Based GWAS Analysis.
Sheet S, Kim JS, Ko MJ, Kim NY, Lim YJ, Park MR, Lee SJ, Kim JM, Oh SI, Choi BH. Sheet S, et al. Animals (Basel). 2021 Nov 2;11(11):3136. doi: 10.3390/ani11113136. Animals (Basel). 2021. PMID: 34827868 Free PMC article. - Patterns of enrichment and acceleration in evolutionary rates of promoters suggest a role of regulatory regions in cetacean gigantism.
Silva FA, Picorelli ACR, Veiga GS, Nery MF. Silva FA, et al. BMC Ecol Evol. 2023 Oct 24;23(1):62. doi: 10.1186/s12862-023-02171-5. BMC Ecol Evol. 2023. PMID: 37872505 Free PMC article.
References
- Chowdhary BP, Raudsepp T. The Horse Genome Derby: racing from map to whole genome sequence. Chromosome Res. 2008;16:109–127. - PubMed
- Binns MM, Boehler DA, Lambert DH. Identification of the myostatin locus (MSTN) as having a major effect on optimum racing distance in the Thoroughbred horse in the USA. Anim Genet. 2010;41(Suppl 2):154–158. - PubMed
- Tozaki T, Hill EW, Hirota K, Kakoi H, Gawahara H, et al. A cohort study of racing performance in Japanese Thoroughbred racehorses using genome information on ECA18. Anim Genet. 2012;43:42–52. - PubMed
Publication types
MeSH terms
LinkOut - more resources
Full Text Sources
Other Literature Sources


