Pretubulysin: from hypothetical biosynthetic intermediate to potential lead in tumor therapy - PubMed (original) (raw)
Pretubulysin: from hypothetical biosynthetic intermediate to potential lead in tumor therapy
Jennifer Herrmann et al. PLoS One. 2012.
Abstract
Pretubulysin is a natural product that is found in strains of myxobacteria in only minute amounts. It represents the first enzyme-free intermediate in the biosynthesis of tubulysins and undergoes post-assembly acylation and oxidation reactions. Pretubulysin inhibits the growth of cultured mammalian cells, as do tubulysins, which are already in advanced preclinical development as anticancer and antiangiogenic agents. The mechanism of action of this highly potent compound class involves the depolymerization of microtubules, thereby inducing mitotic arrest. Supply issues with naturally occurring derivatives can now be circumvented by the total synthesis of pretubulysin, which, in contrast to tubulysin, is synthetically accessible in gram-scale quantities. We show that the simplified precursor is nearly equally potent to the parent compound. Pretubulysin induces apoptosis and inhibits cancer cell migration and tubulin assembly in vitro. Consequently, pretubulysin appears to be an ideal candidate for future development in preclinical trials and is a very promising early lead structure in cancer therapy.
Conflict of interest statement
Competing Interests: The authors have declared that no competing interests exist.
Figures
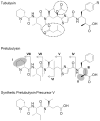
Figure 1. Structural comparison of tubulysin A (R = OH), tubulysin D (R = H), pretubulysin and a synthetic precursor.
The modifications of all synthetic precursors of pretubulysin (I–VIII) are highlighted [I: Mep replaced by _N_-methylsarcosine; II: desmethyl Tup variant; III: missing propionate of Tup; IV: MepIleTuv; V: MepIleMe'Val' (γ-amino acid); VI: MepIleMeVal; VII: MepIle; VIII: Mep].
Figure 2. Comparison of induced G2/M cell cycle arrest in human HepG2 hepatocellular carcinoma cells.
The cells were treated for 24 h with varying concentrations of A) tubulysin A, B) pretubulysin, or C) pretubulysin precursor V as indicated by cell cycle histograms. Fixed cells were analyzed after propidium iodide (PI) staining by flow cytometric measurements (FCM), and histograms of gated populations (excluding debris) were obtained by the Dean-Jett-Fox algorithm (quantitative data can be found as supporting material; Table S1). Histograms are representative results of a set of independent experiments. Arrows indicate the sub-G1 cell populations.
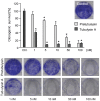
Figure 3. Tubulysin A and pretubulysin inhibit clonogenic survival of L3.6pl cells.
L3.6pl cells were stimulated for 4 h and then seeded at low confluence. After 6 d, the cells were stained with crystal violet, and the absorbance was measured at 550 nm (n = 3; *p≤0.05 Anova/Dunnett).
Figure 4. Typical cellular events upon pretubulysin treatment.
A) Isolated DNA of human promyelocytic HL-60 cells treated with pretubulysin (1: control, 2: 30 nM, 24 h; 3: 75 nM, 24 h; 4: 30 nM, 48 h; 5: 75 nM, 48 h; 6: standard 1000 bp ladder; 7: standard 100 bp ladder). B) Human U-2 OS osteosarcoma cells that were left untreated (upper panel) or were treated for 24 h with pretubulysin (lower panel). Microtubules are visualized by immunofluorescence staining of α-tubulin (pseudocolor green), and nuclei were stained with Hoechst 33342 (pseudocolor blue). The arrows indicate the abnormal accumulation of microtubules in cells after treatment with 25 nM pretubulysin; fragmented nuclei, and completely depolymerized microtubules were observed at a drug concentration of 50 nM.
Figure 5. Immunoblot analysis of tubulysin A- or pretubulysin-treated L3.6pl pancreatic cancer cells.
The cells were treated for the indicated time points with 10 nM tubulysin A or 10 nM pretubulysin. Lysates were immunoblotted for A) Bcl-2 and phosphorylated Bcl-2 (pBcl-2) or B) for PARP; β-actin served as a reference for the quantification of the protein levels. Ctrl.: lysates of untreated control cells.
Figure 6. Induction of apoptosis in L3.6pl cells.
The cells were treated for 48 h with A) varying concentrations of tubulysin A or pretubulysin (n = 2) or B) with 10 nM drug in conjunction with 10 µM caspase inhibitor Q-VD-OPh (n = 3). The percentages of apoptotic cells in the whole cell population were determined by PI staining (*p≤0.05 Anova/Dunnett).
Figure 7. HC Analysis of the cytoplasmic area of U-2 OS cells treated with antimitotic compounds.
A) Representative segmentation images of control U-2 OS cells and epothilone B- or pretubulysin-treated cells that were acquired with 200-fold magnification on a BD Pathway 855 automated microscope and subsequently processed and analyzed in AttoVision v1.6.2. B) Representative results of HC analyses of the average cytoplasmic area of U-2 OS osteosarcoma cells treated for 24 h with antimitotic drugs at varying concentrations. Bars represent the mean ± SEM of all cellular segments within a well.
Figure 8. HC analysis of the standard deviation of tubulin fluorescence.
Representative HCS results of several experiments on tubulin depolymerization. The SD is used as a proxy for the tubulin distribution within the cytoplasmic segment of U-2 OS osteosarcoma cells treated for 24 h with antimitotic drugs at varying concentrations. Arrows indicate peak SD values for depolymerizing agents due to the higher density of microtubules at intermediate drug concentrations. Bars represent the mean ± SEM of all cellular segments within a well.
Figure 9. HC images of control U-2 OS cells and cells treated with pretubulysin.
α-Tubulin was visualized by immunofluorescence, and images were acquired with 200-fold magnification on a BD Pathway 855 automated microscope. The background shows the details of the HC analysis of the SD of tubulin fluorescence (Figure 8).
Figure 10. Representative images of U-2 OS cells treated with 100 nM epothilone B or pretubulysin for 48 h.
Nuclei were stained with Hoechst 33342 (pseudocolor blue, left panel), and γH2A.X was visualized by immunofluorescence (pseudocolor red, right panel). Arrows indicate fragmented nuclei with bright fluorescent spots due to H2A.X phosphorylation events. Images were acquired on a BD Pathway 855 automated microscope and subsequently processed and analyzed in AttoVision v1.6.2 (the full HCS analysis is provided as supplementary material, Figure S2).
Figure 11. Inhibition of L3.6pl pancreatic cancer cell migration by pretubulysin and tubulysin A.
A) ‘Wound healing’ assay. A confluent layer of L3.6pl was scratched and either left untreated or stimulated with varying concentrations of drug (n = 2). Left panel: Regions covered with cells are shown in yellow, and uncovered areas are displayed in gray. Right panel: The percentage of migration is expressed relative to the starvation control (0%) or the untreated control containing FCS (fetal calf serum; 100%). B) Boyden chamber assay with L3.6pl cells that were left untreated or stimulated with 1 or 10 nM drug (n = 2). Cells migrating toward a FCS gradient were stained with crystal violet (left panel), and the percentage of migration (right panel) was expressed relative to the levels of migration for the negative controls with (100%) or without FCS (*p≤0.05 Anova/Dunnett).
Figure 12. In vitro inhibition of tubulin polymerization by tubulysin A, pretubulysin and a small precursor of pretubulysin.
A) As a reference, 1 µM tubulysin A was added to a preparation of 10 µM tubulin, and the absorbance was measured over time at 350 nm; the maximum value of the untreated control was set to 100%. Electron micrographs of the corresponding samples are shown on the right. B) Pretubulysin was either added pre-assembly (left panel) or post-assembly (right panel; the arrow indicates the time at which the drug was added) to a preparation of 10 µM tubulin, and the absorbance was measured at 350 nm; the maximum value of the untreated control was set to 100%. The electron micrographs in the upper corners display different degrees of disruption for both treatment types caused by pretubulysin. C) Tubulin protein was treated pre-assembly with either pretubulysin or its precursor, and the absorbance at 350 nm was measured and then expressed relative to the absorbance of the tubulin control (100%). Electron micrographs show disrupted microtubules upon treatment with pretubulysin or its precursor V. The scale bar on each micrograph is 500 nm.
Similar articles
- Simplified pretubulysin derivatives and their biological effects on cancer cells.
Kubisch R, von Gamm M, Braig S, Ullrich A, Burkhart JL, Colling L, Hermann J, Scherer O, Müller R, Werz O, Kazmaier U, Vollmar AM. Kubisch R, et al. J Nat Prod. 2014 Mar 28;77(3):536-42. doi: 10.1021/np4008014. Epub 2014 Jan 17. J Nat Prod. 2014. PMID: 24437936 - Anti-angiogenic effects of the tubulysin precursor pretubulysin and of simplified pretubulysin derivatives.
Rath S, Liebl J, Fürst R, Ullrich A, Burkhart JL, Kazmaier U, Herrmann J, Müller R, Günther M, Schreiner L, Wagner E, Vollmar AM, Zahler S. Rath S, et al. Br J Pharmacol. 2012 Nov;167(5):1048-61. doi: 10.1111/j.1476-5381.2012.02037.x. Br J Pharmacol. 2012. PMID: 22595030 Free PMC article. - Pretubulysin, a potent and chemically accessible tubulysin precursor from Angiococcus disciformis.
Ullrich A, Chai Y, Pistorius D, Elnakady YA, Herrmann JE, Weissman KJ, Kazmaier U, Müller R. Ullrich A, et al. Angew Chem Int Ed Engl. 2009;48(24):4422-5. doi: 10.1002/anie.200900406. Angew Chem Int Ed Engl. 2009. PMID: 19431172 - Microtubule-targeted anticancer agents and apoptosis.
Bhalla KN. Bhalla KN. Oncogene. 2003 Dec 8;22(56):9075-86. doi: 10.1038/sj.onc.1207233. Oncogene. 2003. PMID: 14663486 Review. - Microtubules, microtubule-interfering agents and apoptosis.
Mollinedo F, Gajate C. Mollinedo F, et al. Apoptosis. 2003 Oct;8(5):413-50. doi: 10.1023/a:1025513106330. Apoptosis. 2003. PMID: 12975575 Review.
Cited by
- Pretubulysin: a new option for the treatment of metastatic cancer.
Braig S, Wiedmann RM, Liebl J, Singer M, Kubisch R, Schreiner L, Abhari BA, Wagner E, Kazmaier U, Fulda S, Vollmar AM. Braig S, et al. Cell Death Dis. 2014 Jan 16;5(1):e1001. doi: 10.1038/cddis.2013.510. Cell Death Dis. 2014. PMID: 24434509 Free PMC article. - Natural products: a continuing source of novel drug leads.
Cragg GM, Newman DJ. Cragg GM, et al. Biochim Biophys Acta. 2013 Jun;1830(6):3670-95. doi: 10.1016/j.bbagen.2013.02.008. Epub 2013 Feb 18. Biochim Biophys Acta. 2013. PMID: 23428572 Free PMC article. Review. - Sporothriolide derivatives as chemotaxonomic markers for Hypoxylon monticulosum.
Surup F, Kuhnert E, Lehmann E, Heitkämper S, Hyde KD, Fournier J, Stadler M. Surup F, et al. Mycology. 2014 Jul 3;5(3):110-119. doi: 10.1080/21501203.2014.929600. Epub 2014 Jun 26. Mycology. 2014. PMID: 25379335 Free PMC article. - KEMTUB012-NI2, a novel potent tubulysin analog that selectively targets hypoxic cancer cells and is potentiated by cytochrome p450 reductase downregulation.
Lazzari P, Spiga M, Sani M, Zanda M, Fleming IN. Lazzari P, et al. Hypoxia (Auckl). 2017 May 23;5:45-59. doi: 10.2147/HP.S132832. eCollection 2017. Hypoxia (Auckl). 2017. PMID: 28580362 Free PMC article. - Three New Stigmatellin Derivatives Reveal Biosynthetic Insights of Its Side Chain Decoration.
Okoth DA, Hug JJ, Garcia R, Müller R. Okoth DA, et al. Molecules. 2022 Jul 21;27(14):4656. doi: 10.3390/molecules27144656. Molecules. 2022. PMID: 35889529 Free PMC article.
References
- Harvey AL. Natural products in drug discovery. Drug Disc Tod. 2008;13:894–901. - PubMed
- Newman DJ, Cragg GM. Natural products as sources of new drugs over the last 25 years. J Nat Prod. 2007;70:461–477. - PubMed
- Li JW, Vederas JC. Drug discovery and natural products: end of an era or an endless frontier? Science. 2009;325:161–165. - PubMed
- Bérdy J. Bioactive microbial metabolites. J Antibiot (Tokyo) 2005;58:1–26. - PubMed
- Fenical W, Jensen PR. Developing a new resource for drug discovery: marine actinomycete bacteria. Nat Chem Biol. 2006;2:666–673. - PubMed
Publication types
MeSH terms
Substances
LinkOut - more resources
Full Text Sources
Other Literature Sources


