Unexpected maintenance of hepatitis C viral diversity following liver transplantation - PubMed (original) (raw)
Unexpected maintenance of hepatitis C viral diversity following liver transplantation
Rebecca R Gray et al. J Virol. 2012 Aug.
Abstract
Chronic hepatitis C virus (HCV) infection can lead to liver cirrhosis in up to 20% of individuals, often requiring liver transplantation. Although the new liver is known to be rapidly reinfected, the dynamics and source of the reinfecting virus(es) are unclear, resulting in some confusion concerning the relationship between clinical outcome and viral characteristics. To clarify the dynamics of liver reinfection, longitudinal serum viral samples from 10 transplant patients were studied. Part of the E1/E2 region was sequenced, and advanced phylogenetic analysis methods were used in a multiparameter analysis to determine the history and ancestry of reinfecting lineages. Our results demonstrated the complexity of HCV evolutionary dynamics after liver transplantation, in which a large diverse population of viruses is transmitted and maintained for months to years. As many as 30 independent lineages in a single patient were found to reinfect the new liver. Several later posttransplant lineages were more closely related to older pretransplant viruses than to viruses detected immediately after transplantation. Although our data are consistent with a number of interpretations, the persistence of high viral genetic variation over long periods of time requires an active mechanism. We discuss possible scenarios, including frequency-dependent selection or variation in selective pressure among viral subpopulations, i.e., the population structure. The latter hypothesis, if correct, could have relevance to the success of newer direct-acting antiviral therapies.
Figures
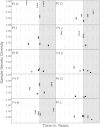
Fig 1
Sample genetic diversity in serum. Plots are shown for patients A to L. Sample genetic viral diversity was assessed for all samples in 10 HCV patients using maximum-likelihood corrected pairwise nucleotide distances for all sequences at a given time point. For each patient, the y axis shows estimated genetic diversity. The x axis represents time going forward. Each of the light gray vertical bars = 1 year. The gray shaded area represents the time after the transplant. Mean and standard error are denoted with a circle and bars.
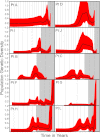
Fig 2
Population genetic diversity. Plots are shown for patients A to L. For each patient, the y axis shows estimated genetic diversity. The x axis represents time going forward. Each of the vertical bars = 1 year. The gray shaded area represents the time after the transplant. The black curve gives the mean estimate of the BSP, and the red area indicates the 95% high posterior density intervals.
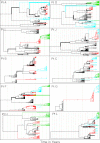
Fig 3
Bayesian phylogenies. Trees are shown for patients A to L where branches are scaled in time with vertical lines indicating years (drawn relative to the last sample). Terminal branches are colored according to the time of sampling: black = pretransplant, red = 1 to 3 months posttransplant, blue = 3 to 20 months posttransplant, green = >20 months posttransplant. Internal branches are colored according to the maximum-parsimony reconstruction of the time of sampling with a time-forward enforcement. Asterisks indicate posterior support > 0.9, and thick branches indicate a lineage containing a positively selected site.
Similar articles
- Characterization of Hepatitis C Virus (HCV) Envelope Diversification from Acute to Chronic Infection within a Sexually Transmitted HCV Cluster by Using Single-Molecule, Real-Time Sequencing.
Ho CKY, Raghwani J, Koekkoek S, Liang RH, Van der Meer JTM, Van Der Valk M, De Jong M, Pybus OG, Schinkel J, Molenkamp R. Ho CKY, et al. J Virol. 2017 Feb 28;91(6):e02262-16. doi: 10.1128/JVI.02262-16. Print 2017 Mar 15. J Virol. 2017. PMID: 28077634 Free PMC article. - Viral entry and escape from antibody-mediated neutralization influence hepatitis C virus reinfection in liver transplantation.
Fafi-Kremer S, Fofana I, Soulier E, Carolla P, Meuleman P, Leroux-Roels G, Patel AH, Cosset FL, Pessaux P, Doffoël M, Wolf P, Stoll-Keller F, Baumert TF. Fafi-Kremer S, et al. J Exp Med. 2010 Aug 30;207(9):2019-31. doi: 10.1084/jem.20090766. Epub 2010 Aug 16. J Exp Med. 2010. PMID: 20713596 Free PMC article. - Liver transplantation with hepatitis C virus-infected graft: interaction between donor and recipient viral strains.
Fan X, Lang DM, Xu Y, Lyra AC, Yusim K, Everhart JE, Korber BT, Perelson AS, Di Bisceglie AM. Fan X, et al. Hepatology. 2003 Jul;38(1):25-33. doi: 10.1053/jhep.2003.50264. Hepatology. 2003. PMID: 12829983 - [Study of hepatitis C virus leukotropism by characterization of viral quasispecies in the liver transplantation setting].
Schramm F, Moenne-Loccoz R, Fafi-Kremer S, Soulier E, Royer C, Weitten T, Brignon N, Ellero B, Woehl-Jaegle ML, Meyer C, Wolf P, Doffoel M, Baumert TF, Gut JP, Stoll-Keller F, Schvoerer E. Schramm F, et al. Pathol Biol (Paris). 2008 Nov-Dec;56(7-8):487-91. doi: 10.1016/j.patbio.2008.07.007. Epub 2008 Oct 7. Pathol Biol (Paris). 2008. PMID: 18842359 Review. French. - Review article: the treatment of genotype 1 chronic hepatitis C virus infection in liver transplant candidates and recipients.
Joshi D, Carey I, Agarwal K. Joshi D, et al. Aliment Pharmacol Ther. 2013 Apr;37(7):659-71. doi: 10.1111/apt.12260. Epub 2013 Feb 21. Aliment Pharmacol Ther. 2013. PMID: 23432320 Review.
Cited by
- Viral and host heterogeneity and their effects on the viral life cycle.
Jones JE, Le Sage V, Lakdawala SS. Jones JE, et al. Nat Rev Microbiol. 2021 Apr;19(4):272-282. doi: 10.1038/s41579-020-00449-9. Epub 2020 Oct 6. Nat Rev Microbiol. 2021. PMID: 33024309 Free PMC article. Review. - Inconsistent temporal patterns of genetic variation of HCV among high-risk subjects may impact inference of transmission networks.
Rose R, Rodriguez C, Dollar JJ, Lamers SL, Massaccesi G, Osburn W, Ray SC, Thomas DL, Cox AL, Laeyendecker O. Rose R, et al. Infect Genet Evol. 2019 Jul;71:1-6. doi: 10.1016/j.meegid.2019.02.025. Epub 2019 Feb 22. Infect Genet Evol. 2019. PMID: 30802530 Free PMC article. - High-Resolution Evolutionary Analysis of Within-Host Hepatitis C Virus Infection.
Raghwani J, Wu CH, Ho CKY, De Jong M, Molenkamp R, Schinkel J, Pybus OG, Lythgoe KA. Raghwani J, et al. J Infect Dis. 2019 May 5;219(11):1722-1729. doi: 10.1093/infdis/jiy747. J Infect Dis. 2019. PMID: 30602023 Free PMC article. - Complex patterns of Hepatitis-C virus longitudinal clustering in a high-risk population.
Rose R, Lamers SL, Massaccesi G, Osburn W, Ray SC, Thomas DL, Cox AL, Laeyendecker O. Rose R, et al. Infect Genet Evol. 2018 Mar;58:77-82. doi: 10.1016/j.meegid.2017.12.015. Epub 2017 Dec 16. Infect Genet Evol. 2018. PMID: 29253674 Free PMC article. - Characterization of Hepatitis C Virus (HCV) Envelope Diversification from Acute to Chronic Infection within a Sexually Transmitted HCV Cluster by Using Single-Molecule, Real-Time Sequencing.
Ho CKY, Raghwani J, Koekkoek S, Liang RH, Van der Meer JTM, Van Der Valk M, De Jong M, Pybus OG, Schinkel J, Molenkamp R. Ho CKY, et al. J Virol. 2017 Feb 28;91(6):e02262-16. doi: 10.1128/JVI.02262-16. Print 2017 Mar 15. J Virol. 2017. PMID: 28077634 Free PMC article.
References
- Arenas JI, et al. 2004. Hepatitis C virus quasi-species dynamics predict progression of fibrosis after liver transplantation. J. Infect. Dis. 189:2037–2046 - PubMed
- Centers for Disease Control and Prevention 2010. Hepatitis C FAQs for the public. Centers for Disease Control and Prevention, Atlanta, GA: http://www.cdc.gov/hepatitis/C/cFAQ.htm
- Drummond AJ, Rambaut A, Shapiro B, Pybus OG. 2005. Bayesian coalescent inference of past population dynamics from molecular sequences. Mol. Biol. Evol. 22:1185–1192 - PubMed
Publication types
MeSH terms
Substances
Grants and funding
- UL1 RR029890/RR/NCRR NIH HHS/United States
- UL1 TR000064/TR/NCATS NIH HHS/United States
- K24 DK066144/DK/NIDDK NIH HHS/United States
- T32 CA912629/CA/NCI NIH HHS/United States
- MRC_/Medical Research Council/United Kingdom
- K24 CA139570/CA/NCI NIH HHS/United States
LinkOut - more resources
Full Text Sources
Medical
Molecular Biology Databases
Research Materials


