Distinct neural stem cell populations give rise to disparate brain tumors in response to N-MYC - PubMed (original) (raw)
Comparative Study
. 2012 May 15;21(5):601-613.
doi: 10.1016/j.ccr.2012.04.012.
Vasil Savov 2, Anders I Persson 3, Justin Chen 3, Christopher S Hackett 3, Paul A Northcott 4, Matthew R Grimmer 3, Jasmine Lau 3, Louis Chesler 5, Arie Perry 3, Joanna J Phillips 3, Michael D Taylor 4, William A Weiss 6
Affiliations
- PMID: 22624711
- PMCID: PMC3360885
- DOI: 10.1016/j.ccr.2012.04.012
Comparative Study
Distinct neural stem cell populations give rise to disparate brain tumors in response to N-MYC
Fredrik J Swartling et al. Cancer Cell. 2012.
Abstract
The proto-oncogene MYCN is mis-expressed in various types of human brain tumors. To clarify how developmental and regional differences influence transformation, we transduced wild-type or mutationally stabilized murine N-myc(T58A) into neural stem cells (NSCs) from perinatal murine cerebellum, brain stem, and forebrain. Transplantation of N-myc(WT) NSCs was insufficient for tumor formation. N-myc(T58A) cerebellar and brain stem NSCs generated medulloblastoma/primitive neuroectodermal tumors, whereas forebrain NSCs developed diffuse glioma. Expression analyses distinguished tumors generated from these different regions, with tumors from embryonic versus postnatal cerebellar NSCs demonstrating Sonic Hedgehog (SHH) dependence and SHH independence, respectively. These differences were regulated in part by the transcription factor SOX9, activated in the SHH subclass of human medulloblastoma. Our results demonstrate context-dependent transformation of NSCs in response to a common oncogenic signal.
Copyright © 2012 Elsevier Inc. All rights reserved.
Conflict of interest statement
The authors declare no conflict of interest.
Figures
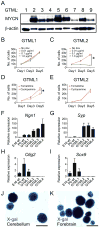
Figure 1. GLT1 drives _MYCN_-dependent, predominantly SHH-negative medulloblastoma and is a fate determinant for NSCs
(A) Immunoblot of MYCN in GTML MB spheres (passages 6–10). (B–C) Proliferation of MYCN-low (GTML1) and MYCN-high (GTML2) spheres as indicated. (D–E) All GTML sphere lines except GTML1 were insensitive to the SMO inhibitor cyclopamine (5μM). Tomatidine, 5μM, was used as control. (F–I) Relative expression of neuronal markers Ngn1 and Syp; and Olig2 and Sox9 that are expressed in glial cells in embryonic (E16 WT), and postnatal (P0 WT) normal neurospheres and tumor spheres GTML1-4. (J–K) GLT1-positive origin shown by X-gal fate mapping in NSCs isolated from postnatal (P0) cerebellum and postnatal (P0) forebrain from a _Glt1_-tTA; TRE-Cre-Rosa26-LSL-LacZ mouse. Error bars: +/− Standard Deviation (SD). Scale: 100μm. See also Figure S1.
Figure 2. NSC-selective infection with N-mycT58A alters proliferation and differentiation
(A) NSCs isolated from E16 and P0 forebrain (ventricular zone), E16 and P0 hindbrain (total cerebellum) and E14, E16 and P0 brain stem (ventricular zone/lower rhombic lip) from mice transgenic for Gtv-a were cultured for 7d in NB media on low-affinity plates with one or two passages. RCAS viruses containing GFP, N-mycWT (N-MYC) or N-mycT58A (T58A) came from supernatants of DF-1 virus producing cells (see Figure S2). NSCs were transduced with RCAS viruses mixed 1:1 with fresh NB media. Cells were infected (72h), dissociated and cultured in fresh NB media. Cells were orthotopically transplanted in nude mice 7 days after RCAS infection. (B) Selective infection of GFAP-positive P0 cerebellar NSCs, evidenced by co-expression of RCAS-GFP (green) with GFAP (blue) 72h after growth factor depletion. TUJ1 (red). Scale: 25 μm. (C) Immunoblot of FLAG-tagged N-mycWT or N-mycT58A in P0 cerebellar NSCs. NGN1 and β-actin control are also shown. (D–F) Proliferation at 3, 5 and 7 days after transduction with GFP, N-mycWT or N-mycT58A of P0 NSCs isolated from cerebellum (D), forebrain (E) and dorsal brain stem/lower rhombic lip (F) respectively. (G–J) Growth factor independence assay showing sphere diameter (as indicated) and number of secondary spheres in P0 cerebellar NSCs transduced with GFP, N-mycWT or N-mycT58A and in GTML2 spheres. Although not indicated, there are significantly more spheres irrespective of size in “GF conditions” (FGF, EGF or FGF+EGF) as compared to “no GF conditions” when analyzing GFP-, N-MYC- and T58A-transduced NSCs, respectively, when using Student’s _t_-test (p < 0.05). Error bars: +/− SD. See also Figure S2.
Figure 3. The _N-mycT58A_-driven neuronal program depends on regional origin and NSC age
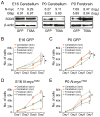
(A) Levels of N-myc and Gfap from Affymetrix exon arrays (log2 values) and immunoblots of SOX9 and β-actin in E16 and P0 cerebellar and P0 forebrain NSCs transduced with GFP or N-mycT58A, respectively. (B–E) Proliferation (7 days) of cerebellar and forebrain NSCs transduced with GFP (B–C) or N-mycT58A (D–E) and treated with cyclopamine (cyc) or tomatidine (tom) in 5μM final concentrations for E16 and P0 ages, respectively. Error bars: +/− SD. * indicates p < 0.05 from Student’s _t_-test. See also Figure S3.
Figure 4. N-mycT58A induces brain tumors from both cerebellum and forebrain
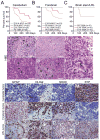
(A–C) Survival of mice orthotopically transplanted with 100,000 NSCs isolated from forebrain, cerebellum and brain stem/LRL, transduced with N-mycWT or N-mycT58A viruses. n=number of mice per group. Mice injected with N-mycWT NSCs (green colors) or N-mycT58A E16 and P0 brain stem/LRL (red and green, respectively) generated no tumors. (D–I) Histopathology of representative P0 cerebellar (D and E), P0 forebrain (F and G), and E14 brain stem/LRL (H–I) N-mycT58A tumors (H&E staining). Cerebellar tumors displayed MB features, including cell wrapping in a tumor with prominent LC/A features (D, arrowhead) and Homer Wright rosettes (E, arrowhead). Forebrain tumors displayed diffuse invasion of tumor cells along white matter tracts (arrowhead) (G). LRL tumors displayed marked cellular and nuclear pleomorphism (I, arrowhead). Box in H (200x) denotes region shown at higher magnification in I (400x). (J–U) Immunostaining, of representative _N-mycT58A_-induced cerebellar, forebrain, and LRL tumors demonstrating greater neuronal differentiation in cerebellar tumors, greater glial differentiation in forebrain tumors, and intermediate differentiation in LRL tumors. * indicate tumor region in pictures where an adjacent normal brain is present. Scale: 100μm. See also Figure S4 and Table S1.
Figure 5. SOX9 marks a SHH-dependent brain tumor profile
(A) Expression analysis of 103 primary MB samples clustered in four MB subgroups, WNT, SHH, Group 3 and Group 4 with levels normalized to normal adult cerebella (n=5) as described previously (Northcott et al., 2011). Dark blue represents the lowest and dark red the highest expression. (B–E) SOX9 immunostaining in representative human MB (B and C) and glioma (D and E) sections, without and with MYCN amplification, as determined by fluorescent in situ hybridization (Perry et al., 2009). Scale: 100μm. See also Figure S5 and Table S2.
Figure 6. N-mycT58A tumors, GTML tumors, and normal murine tissues show discrete expression signatures
Dendrogram showing unsupervised hierarchical clustering from Affymetrix exon array data obtained from: (1) Primary and Tumor-Derived Cells (yellow): Four individual GFP-transduced E16 and P0 cerebellar (sorted or unsorted for GFP-infection using cell sorting) NSCs, P0 forebrain NSCs, two _N-mycT58A_-transduced E16 and P0 cerebellar NSCs (in low passages) and three cell lines (in low passages) derived from orthotopic E16 and P0 cerebellar and P0 forebrain tumors. (2) Orthotopic Tumors (red): Nine freshly isolated orthotopic E16 and P0 cerebellar and P0 forebrain _N-mycT58A_-tumors. (3) GTML Tumors (purple): 32 isolated GTML tumors and one cultured GTML tumor cell line (GTML2). (4) Normal Cerebellum (blue): Four samples from P7 GTML double heterozygous total cerebella. The distance in the clustering determines how well samples are related to each other. See also Figure S6.
Figure 7. N-MYC drives both SHH-dependent and SHH-independent MB
(A–C) Relative expression of Sox9, N-myc and Math1 in five disparate N-MYC-driven murine tumors, E16 MB (n=4), P0 MB (n=6), E16 glioma (n=4), P0 glioma (n=6) and E14 LRL tumor (n=3). n=number of individual tumors. Boxes are the first to third quartile with the median indicated. No boxes are shown for LRL tumors because of few samples (n=3). Whiskers go from min to max values. (D) Proliferation of cultures of E16 MB, P0 MB and P0 glioma isolated from individual tumors and treated with cyclopamine (cyc) or tomatidine (tom) used at final concentrations of 5μM. * indicates statistical significance (p < 0.05) from Student’s _t_-test. Error bars: +/− SD. See also Figure S7 and Table S3.
Figure 8. SOX9 promotes self-renewal and N-MYC-driven brain tumor incidence
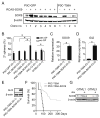
(A) Immunoblot of NSCs generated from single cells of GFP- and SOX9-transduced P0 cerebellar NSCs from normal (six individual clones) and N-mycT58A transduced NSCs (three individual clones). (B) Limiting dilution assay showing secondary (2°) spheres cultured starting from one single cell per well (with or without (wo) EGF and FGF). Numbers indicates mean values (from two experiments) of spheres per well from a total of 60 wells counted (shown as %). Clone numbers used (from A) are indicated. Assay results from single clones from a P0 MB tumor (P0C-T3 (Cl.1)) and from a GTML tumor (GTML2 (Cl.1)) are also included. * indicates statistical significance (p < 0.05) from Student’s _t_-test. (C–D) Relative expression of SOX9 and Gli2 in _N-mycT58A_-transduced P0 cerebellar NSCs and _N-mycT58A_-transduced P0 cerebellar NSCs further transduced with SOX9 (P0C-T58A-SOX9 Cl.3), respectively. For SOX9 expression and clone numbers, see A. * indicates statistical significance (p < 0.05) from Student’s _t_-test. (E) Immunoblot showing GLI2 protein expression in _N-mycT58A_-transduced P0 cerebellar normal (P0C-T58A Cl.1) or SOX9-transduced (P0C-T58A-SOX9 Cl.3) clones. (F) Survival after orthotopic transplantation of 100,000 cells from N-mycT58A P0 cerebellar NSCs (P0C-T58A, as used in Figure 4A; n=30) and N-mycT58A P0 cerebellar NSCs further transduced with SOX9 (P0C-T58A-SOX9, n=10), respectively. Same clone (Cl.3) was used as in C–E. (G) Re-expression of SOX9 in representative GTML spheres (GTML3) treated with dox (1μg/ml) after 72h as shown in an immunoblot, with GTML1 cells as controls. * indicates statistical significance (p < 0.05) from Student’s _t_-test. Error bars: +/− SD. See also Figure S8.
Comment in
- There's a time and a place for MYCN.
Phoenix TN, Gilbertson RJ. Phoenix TN, et al. Cancer Cell. 2012 May 15;21(5):593-595. doi: 10.1016/j.ccr.2012.05.001. Cancer Cell. 2012. PMID: 22624707
Similar articles
- BarTeL, a Genetically Versatile, Bioluminescent and Granule Neuron Precursor-Targeted Mouse Model for Medulloblastoma.
Shackleford GM, Shi XH, Swanson KS, Mahdi MY, Gonzalez-Gomez I, Asgharzadeh S, D'Apuzzo M, Erdreich-Epstein A, Moats RA. Shackleford GM, et al. PLoS One. 2016 Jun 16;11(6):e0156907. doi: 10.1371/journal.pone.0156907. eCollection 2016. PLoS One. 2016. PMID: 27310018 Free PMC article. - Sleeping Beauty Insertional Mutagenesis Reveals Important Genetic Drivers of Central Nervous System Embryonal Tumors.
Beckmann PJ, Larson JD, Larsson AT, Ostergaard JP, Wagner S, Rahrmann EP, Shamsan GA, Otto GM, Williams RL, Wang J, Lee C, Tschida BR, Das P, Dubuc AM, Moriarity BS, Picard D, Wu X, Rodriguez FJ, Rosemarie Q, Krebs RD, Molan AM, Demer AM, Frees MM, Rizzardi AE, Schmechel SC, Eberhart CG, Jenkins RB, Wechsler-Reya RJ, Odde DJ, Huang A, Taylor MD, Sarver AL, Largaespada DA. Beckmann PJ, et al. Cancer Res. 2019 Mar 1;79(5):905-917. doi: 10.1158/0008-5472.CAN-18-1261. Epub 2019 Jan 23. Cancer Res. 2019. PMID: 30674530 Free PMC article. - The p53 inhibitor MDM2 facilitates Sonic Hedgehog-mediated tumorigenesis and influences cerebellar foliation.
Malek R, Matta J, Taylor N, Perry ME, Mendrysa SM. Malek R, et al. PLoS One. 2011 Mar 18;6(3):e17884. doi: 10.1371/journal.pone.0017884. PLoS One. 2011. PMID: 21437245 Free PMC article. - Childhood tumors of the nervous system as disorders of normal development.
Grimmer MR, Weiss WA. Grimmer MR, et al. Curr Opin Pediatr. 2006 Dec;18(6):634-8. doi: 10.1097/MOP.0b013e32801080fe. Curr Opin Pediatr. 2006. PMID: 17099362 Review. - Medulloblastoma: developmental mechanisms out of control.
Marino S. Marino S. Trends Mol Med. 2005 Jan;11(1):17-22. doi: 10.1016/j.molmed.2004.11.008. Trends Mol Med. 2005. PMID: 15649818 Review.
Cited by
- Joint metabolomics and transcriptomics analysis systematically reveal the impact of MYCN in neuroblastoma.
Du B, Zhang Y, Zhang P, Zhang M, Yu Z, Li L, Hou L, Wang Q, Zhang X, Zhang W. Du B, et al. Sci Rep. 2024 Aug 30;14(1):20155. doi: 10.1038/s41598-024-71211-x. Sci Rep. 2024. PMID: 39215128 Free PMC article. - MYCN in human development and diseases.
Nishio Y, Kato K, Oishi H, Takahashi Y, Saitoh S. Nishio Y, et al. Front Oncol. 2024 May 31;14:1417607. doi: 10.3389/fonc.2024.1417607. eCollection 2024. Front Oncol. 2024. PMID: 38884091 Free PMC article. Review. - A multi-omics approach for biomarker discovery in neuroblastoma: a network-based framework.
Hussein R, Abou-Shanab AM, Badr E. Hussein R, et al. NPJ Syst Biol Appl. 2024 May 17;10(1):52. doi: 10.1038/s41540-024-00371-3. NPJ Syst Biol Appl. 2024. PMID: 38760476 Free PMC article. - LOXL1-AS1 contributes to metastasis in sonic-hedgehog medulloblastoma by promoting cancer stem-like phenotypes.
Do AD, Wu KS, Chu SS, Giang LH, Lin YL, Chang CC, Wong TT, Hsieh CL, Sung SY. Do AD, et al. J Exp Clin Cancer Res. 2024 Apr 30;43(1):130. doi: 10.1186/s13046-024-03057-0. J Exp Clin Cancer Res. 2024. PMID: 38689348 Free PMC article. - A germline point mutation in the MYC-FBW7 phosphodegron initiates hematopoietic malignancies.
Freie B, Carroll PA, Varnum-Finney BJ, Ramsey EL, Ramani V, Bernstein I, Eisenman RN. Freie B, et al. Genes Dev. 2024 Apr 17;38(5-6):253-272. doi: 10.1101/gad.351292.123. Genes Dev. 2024. PMID: 38565249 Free PMC article.
References
- Ahn S, Joyner AL. In vivo analysis of quiescent adult neural stem cells responding to Sonic hedgehog. Nature. 2005;437:894–897. - PubMed
- Akazawa C, Ishibashi M, Shimizu C, Nakanishi S, Kageyama R. A mammalian helix-loop-helix factor structurally related to the product of Drosophila proneural gene atonal is a positive transcriptional regulator expressed in the developing nervous system. J Biol Chem. 1995;270:8730–8738. - PubMed
- Alcock J, Sottile V. Dynamic distribution and stem cell characteristics of Sox1-expressing cells in the cerebellar cortex. Cell Res. 2009;19:1324–1333. - PubMed
- Bagheri-Fam S, Barrionuevo F, Dohrmann U, Gunther T, Schule R, Kemler R, Mallo M, Kanzler B, Scherer G. Long-range upstream and downstream enhancers control distinct subsets of the complex spatiotemporal Sox9 expression pattern. Dev Biol. 2006;291:382–397. - PubMed
Publication types
MeSH terms
Substances
Grants and funding
- K08 NS063456-04/NS/NINDS NIH HHS/United States
- CA159859/CA/NCI NIH HHS/United States
- R01 CA159859-03/CA/NCI NIH HHS/United States
- R01 CA133091/CA/NCI NIH HHS/United States
- K08 NS063456-03/NS/NINDS NIH HHS/United States
- R01 CA133091-02/CA/NCI NIH HHS/United States
- R01 CA159859/CA/NCI NIH HHS/United States
- R01 CA133091-01A1/CA/NCI NIH HHS/United States
- CA148699/CA/NCI NIH HHS/United States
- K08 NS063456-02S1/NS/NINDS NIH HHS/United States
- R01 CA159859-01/CA/NCI NIH HHS/United States
- R01 CA133091-03/CA/NCI NIH HHS/United States
- R01 CA148699/CA/NCI NIH HHS/United States
- R01 CA148699-01/CA/NCI NIH HHS/United States
- K08 NS063456-05/NS/NINDS NIH HHS/United States
- R01 CA133091-04/CA/NCI NIH HHS/United States
- K08 NS063456-01/NS/NINDS NIH HHS/United States
- R01 CA133091-05/CA/NCI NIH HHS/United States
- K08 NS063456-02/NS/NINDS NIH HHS/United States
- R01 CA148699-02/CA/NCI NIH HHS/United States
- R01 CA159859-02/CA/NCI NIH HHS/United States
- K08 NS063456/NS/NINDS NIH HHS/United States
- R01 CA148699-03/CA/NCI NIH HHS/United States
LinkOut - more resources
Full Text Sources
Other Literature Sources
Medical
Molecular Biology Databases
Research Materials


