Microglia sculpt postnatal neural circuits in an activity and complement-dependent manner - PubMed (original) (raw)
Microglia sculpt postnatal neural circuits in an activity and complement-dependent manner
Dorothy P Schafer et al. Neuron. 2012.
Abstract
Microglia are the resident CNS immune cells and active surveyors of the extracellular environment. While past work has focused on the role of these cells during disease, recent imaging studies reveal dynamic interactions between microglia and synaptic elements in the healthy brain. Despite these intriguing observations, the precise function of microglia at remodeling synapses and the mechanisms that underlie microglia-synapse interactions remain elusive. In the current study, we demonstrate a role for microglia in activity-dependent synaptic pruning in the postnatal retinogeniculate system. We show that microglia engulf presynaptic inputs during peak retinogeniculate pruning and that engulfment is dependent upon neural activity and the microglia-specific phagocytic signaling pathway, complement receptor 3(CR3)/C3. Furthermore, disrupting microglia-specific CR3/C3 signaling resulted in sustained deficits in synaptic connectivity. These results define a role for microglia during postnatal development and identify underlying mechanisms by which microglia engulf and remodel developing synapses.
Copyright © 2012 Elsevier Inc. All rights reserved.
Figures
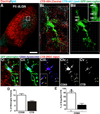
Figure 1. Microglia engulf RGC inputs undergoing active synaptic pruning in the dLGN
A, A representative low magnification image of P5 dLGN. Ipsilateral inputs are labeled with CTB-647 (blue) and contralateral inputs are labeled with CTB-594 (red). Scale bar = 100 µm. Bi, A microglia (EGFP, green) sampled from the border region of ipsilateral (blue) and contralateral (red) projections (inset in A). Bii, All CTB fluorescence outside the microglial volume has been subtracted revealing RGC inputs (red and blue) that have been engulfed (arrows, enlarged in inset). Grid line increments = 5 µm. Ci, A representative microglia (green, EGFP) from P5 dLGN. RGC inputs from both eyes are labeled with CTB-594 (red) and lysosomes are labeled with anti-CD68 (blue). Cii, The same microglia in which all CTB fluorescence outside the microglia volume has been removed revealing lysosomes (blue) and engulfed RGC inputs (red). Ciii, The same cell in which only the lysosomes (blue) and RGC inputs (red) are visualized in which mostinputs (red) are localized within CD68-positive lysosomes (blue; white arrows). There are few instances in which CTB is not localized to lysosomes (yellow asterisks). Inset is enlarged region of Ciii. Civ-v, The CD68 (Civ) and CTB (Cv) channels alone. Scale bar = 10 µm. D, Quantification of % volume of microglia occupied by CD68-positive lysosomes (white bar) and RGC inputs (black bar), n=3 P5 mice. E, There are significantly more engulfed inputs localized to lysosomal compartments (white bars) versus non-lysosomal compartments (black bars). *P<0.001 by Student’s _t_-test, n=3 P5 mice. All error bars represent s.e.m. See also Figure S1 and Movie S1 and S2.
Figure 2. Microglia-mediated engulfment of RGC inputs is developmentally regulated
A, Schematic of retinogeniculate pruning and strategy used for assessing engulfment. Contralateral (red) and ipsilateral (blue) inputs overlap at early postnatal ages (P5). Inputs from both eyes prune throughout the dLGN during the first postnatal week and is largely complete by P9/10. Engulfment was analyzed throughout the dLGN. B, Engulfment of RGC inputs is significantly increased during peak pruning in the dLGN (P5). *P<0.001 by one-way ANOVA, n=3 mice/age. C, Engulfment in P5 dLGN occurs most significantly in synapse-enriched (contralateral and ipsilateral dLGN) versus non-synaptic (optic tract) regions. *P<0.01 by Student’s _t_-test, n=3 P5 mice. All error bars represent s.e.m. D, Representative surface rendered microglia from P5 (fluorescent image is shown in 1B), P9, and P30 mouse dLGN. Engulfment of RGC inputs occurs during peak pruning (P5) versus older ages (P9 and P30). Enlarged insets denoted with a black dotted line. Grid line increments = 5 µm. See also Figure S2.
Figure 3. Microglia-mediated engulfment of RGC inputs is regulated by neural activity
A, D Schematic of strategies used for assessing microglia engulfment following disruption of dLGN pruning by manipulation of neuronal activity. B. Representative P5 microglia (green) surface rendered from the border region of ipsilateral and contralateral projections in which left and right eyes were treated with TTX (red) and vehicle (blue), respectively. Inset is an enlarged region demonstrating the increase in engulfment of inputs from the ‘weaker’, TTX-treated eye (red) as compared to those inputs derived from the ‘stronger’ vehicle-treated eye (blue). Grid line increments = 5 µm. C, Significantly more TTX-treated inputs (black bar) are engulfed as compared to vehicle-treated inputs (white bar). *P<0.04 by Student’s _t_-test, n=4 mice/treatment. E. Representative P5 microglia (green) surface rendered from the border region of ipsilateral and contralateral projections in which left and right eyes were treated with forskolin (red) and vehicle (blue), respectively. Inset is an enlarged region demonstrating an increase in engulfment of inputs from the ‘weaker’, vehicle-treated eye (blue) as compared to those inputs derived from the ‘stronger’ forskolin-treated eye (red). Grid line increments = 5 µm. F, Significantly more vehicle-treated inputs (white bar) are engulfed as compared to forskolin-treated inputs (black bar) within the same dLGN. *P<0.04 by Student’s _t_-test, n= 5 mice/treatment. All error bars represent s.e.m. See also Figure S3.
Figure 4. Microglia engulf preysnaptic elements undergoing active synaptic pruning
Ai, Bi. Low magnification EM of microglia. Asterisks denote the nucleus and the cytoplasm is pseudocolored green. Scale bar = 1 µm. Aii, Bii. Magnified regions of Ai and Bi (white boxes) demonstrating membrane-bound elements engulfed by microglia. Arrows designate elements containing presynaptic machinery (40 nm vesicles). The arrowhead in Aii designates engulfed material resembling juxtaposed postsynaptic elements. Scale bar = 100 nm. C, Low magnification EM of a microglia immunolabeled for iba-1 in P5 dLGN (DAB-positive cell). Red and blue boxes indicate enlarged regions in D and E, respectively. Scale bar = 2 µm. D, RGC input (A) localized within the iba-1-positive microglia (M). Within the engulfed input, neurofilaments (arrows, enlarged in Di and Dii) and 40 nm vesicles (asterisks, enlarged in Dii) are indicative of presynaptic machinery. D, Scale bar = 500 nm. E, RGC input (A) enwrapped by a microglial process (M, arrowheads denote microglial process). 40 nm Vesicles are also visible (asterisks, enlarged region in Ei). Another presynaptic element (a) containing 40 nm vesicles is surrounded by microglia cytoplasm (enlarged region in Eii). Scale bars = 100 nm. F, An intact excitatory synapse in P5 dLGN in which the presynaptic terminal (asterisk) contains 40 nm vesicles. Scale bar = 500 nm. G, Cross (asterisks) or longitudinal sections (pseudocolor) through axons are relatively void of vesicles. Scale bars=500 nm. H, A membrane-bound structure (arrowhead) completely within a microglial (M) lysosome (L). Scale bar = 500 nm. I, The frequency at which engulfed material was observed in microglia from P5 dLGN, n=20 cells. Error bars represent s.e.m. See also Figure S4.
Figure 5. Microglia engulf presynaptic terminals specific to RGCs
A–D, 3D-SIM in P5 CX3CR1+/EGFP dLGN in which microglia are labeled with EGFP (green) and RGC presynaptic terminals are immunolabeled with anti-VGlut2 (red). A, Maximum intensity projection (MIP) of microglia and VGlut2 immunostaining in P5 dLGN. B, MIP in which all VGlut2 fluorescence (red) that is not within the microglia (green) has been subtracted. Yellow arrow designates examples of engulfed VGlut2-positive elements, enlarged in inset. C,D Orthogonal views (C) and surface rendering (D) of region in B (yellow arrow and inset). A–D, Scale bar = 5 µm. D, grid line increments = 2 µm. E–G, Double immunoEM in P5 dLGN for iba-1 (DAB) and VGlut2 (immunogold). E, RGC presynaptic terminals are enriched with VGlut2 immunoreactivity (immunogold, yellow arrows). F,G, Similar to RGC terminals (E), microglial cytoplasm (DAB) and lysosomes contain VGlut2 immunogold labeling (yellow arrows). Asterisk in F denotes a VGlut2-positive presynaptic terminal within the same field of view as the microglia. Scale bars = 100nm. H, Cumulative probability demonstrates that there is increased probability of VGlut2 localization to a RGC terminal (black solid line) or microglia (grey solid line) versus random occurrence throughout the neuropil (grey dotted line). For each structure, n=10.
Figure 6. CR3/C3-dependent signaling regulates engulfment of synaptic inputs by microglia
A, Immunohistochemistry for the alpha subunit of CR3 (CD11b) reveals that microglia express high levels of CR3/CD11b (left column) in the P5 dLGN (top panels) versus older ages (P20, bottom panels). Total microglia are visualized with GFP (CX3CR1+/EGFP, right column). Insets are magnified regions (red asterisks). Scale bar = 100 µm. B, Immunohistochemistry in the developing dLGN for C3 (red). A single plane confocal image reveals that C3 levels are increased in the P5 dLGN versus older ages (P9, P60). Scale bar = 10 µm. C, E, Representative surface rendered microglia (green) from P5 dLGN of WT (left) or KO (right) littermates in which RGC inputs were labeled with CTB-594 (red, contralateral) and CTB-647 (blue, ipsilateral). Insets are enlarged regions demonstrating reduced RGC input engulfment (red and blue) in CR3 (C) and C3 (E) KO mice. Grid line increments = 5 µm. D,F, P5 CR3 KO (D) and C3 KO (F) mice (black bars) engulf significantly fewer RGC inputs as compared to WT littermates (white bars). All data are normalized to WT control values. D, *P<0.04 by Student’s _t_-test, n=3 mice/genotype. E, *P<0.01 Student’s _t_-test, n=4 mice/genotype. All error bars represent s.e.m. See also Figure S5.
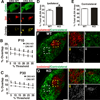
Figure 7. CR3 KO mice have sustained deficits in eye-specific segregation
A, Representative image of a P30 WT (left) demonstrates minimal overlap (yellow) between ipsilateral (red) and contralateral (green) RGC inputs. Indicative of a synaptic pruning deficit, CR3 KO mice (right) had increased overlap (yellow) of ipsilateral (red) and contralateral (green) RGC inputs. Scale bar = 100 µm. B–C, P10 (B) and P30 (C) CR3 KO mice had statistically significant, threshold-independent deficits in retinogeniculate pruning. D, The percentage of ipsilateral territory is significantly increased in P30 CR3 KO mice as compared to WT littermate controls. E, Although trending towards an increase, there is no statistically significant difference in percentage of contralateral territory. F, G dLGN from P30 CR3 WT (F) or KO (G) mice, dotted line boxes in lower magnification image (left panels) correspond to ipsilateral region magnified in middle panels (yellow i–ii) or contralateral region magnified in far right panels (white i–ii). Bottom panels in F,G (ii) are contralateral (CTB-488, green, left panel) channel or ipislateral (CTB-594, red, right panel) alone. G, There were increased aberrant contralateral projections (middle panel; i, green and ii) within the ipsilateral territory in P30 CR3 KO mice as compared to WT littermates (F, middle panel). Similarly, there were aberrant ipsilateral projections (right panel; i, red and ii) within contralateral regions of the dLGN in CR3 KO mice as compared to WT littermates (F, right panel). Left panels, scale bar = 100 µm. Middle and right panels, scale bar = 10 µm. B–C, *P<0.0001 by Student’s _t_-test, n=6 (P10) or 4 (P30) mice/genotype. D, *P<0.03 by Student’s _t_-test, n=4 mice/genotype. All error bars represent s.e.m. See also Figure S6.
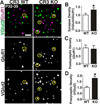
Figure 8. CR3 KO mice have a sustained increase in synapse density
A, Single plane array tomography images for VGlut2 (green) to label RGC terminals and GluR1 (purple) to label postsynaptic excitatory sites in P32-35 dLGN of CR3 KO (right) and WT littermate controls (left). Yellow circles indicate synapses defined by VGlut2 and GluR1 immunoreactivity. Scale bar = 2 µm. B-D, Quantification of retinogeniculate synapse (B, VGlut2/GluR1-positive), postsynaptic (C, GluR1), and presynaptic/RGC terminal (D, VGlut2) density indicates that there is a statistically significant increase in retinogeniculate synapse density and total RGC terminal density in CR3 KOs as compared to WT littermates. *P<0.03 Man-Whitney U test, n=3 mice/genotype. Error bars represent s.e.m. See also Figure S7.
Comment in
- Complement-mediated microglial clearance of developing retinal ganglion cell axons.
Tyler CM, Boulanger LM. Tyler CM, et al. Neuron. 2012 May 24;74(4):597-9. doi: 10.1016/j.neuron.2012.05.002. Neuron. 2012. PMID: 22632716 Free PMC article.
Similar articles
- Microglia Under the Spotlight: Activity and Complement-Dependent Engulfment of Synapses.
Thion MS, Garel S. Thion MS, et al. Trends Neurosci. 2018 Jun;41(6):332-334. doi: 10.1016/j.tins.2018.03.017. Trends Neurosci. 2018. PMID: 29801526 - CD47 Protects Synapses from Excess Microglia-Mediated Pruning during Development.
Lehrman EK, Wilton DK, Litvina EY, Welsh CA, Chang ST, Frouin A, Walker AJ, Heller MD, Umemori H, Chen C, Stevens B. Lehrman EK, et al. Neuron. 2018 Oct 10;100(1):120-134.e6. doi: 10.1016/j.neuron.2018.09.017. Neuron. 2018. PMID: 30308165 Free PMC article. - Microglia remodel synapses by presynaptic trogocytosis and spine head filopodia induction.
Weinhard L, di Bartolomei G, Bolasco G, Machado P, Schieber NL, Neniskyte U, Exiga M, Vadisiute A, Raggioli A, Schertel A, Schwab Y, Gross CT. Weinhard L, et al. Nat Commun. 2018 Mar 26;9(1):1228. doi: 10.1038/s41467-018-03566-5. Nat Commun. 2018. PMID: 29581545 Free PMC article. - Microglia: Lifelong modulator of neural circuits.
Ikegami A, Haruwaka K, Wake H. Ikegami A, et al. Neuropathology. 2019 Jun;39(3):173-180. doi: 10.1111/neup.12560. Epub 2019 May 27. Neuropathology. 2019. PMID: 31131941 Review. - The "quad-partite" synapse: microglia-synapse interactions in the developing and mature CNS.
Schafer DP, Lehrman EK, Stevens B. Schafer DP, et al. Glia. 2013 Jan;61(1):24-36. doi: 10.1002/glia.22389. Epub 2012 Jul 24. Glia. 2013. PMID: 22829357 Free PMC article. Review.
Cited by
- Activity-dependent synapse clustering underlies eye-specific competition in the developing retinogeniculate system.
Zhang C, Vatan T, Speer CM. Zhang C, et al. bioRxiv [Preprint]. 2024 Oct 22:2023.09.28.560055. doi: 10.1101/2023.09.28.560055. bioRxiv. 2024. PMID: 39484601 Free PMC article. Preprint. - Glutamate and microglia activation as a driver of dendritic apoptosis: a core pathophysiological mechanism to understand schizophrenia.
Parellada E, Gassó P. Parellada E, et al. Transl Psychiatry. 2021 May 6;11(1):271. doi: 10.1038/s41398-021-01385-9. Transl Psychiatry. 2021. PMID: 33958577 Free PMC article. Review. - The Contribution of Microglia to the Development and Maturation of the Visual System.
Dixon MA, Greferath U, Fletcher EL, Jobling AI. Dixon MA, et al. Front Cell Neurosci. 2021 Apr 23;15:659843. doi: 10.3389/fncel.2021.659843. eCollection 2021. Front Cell Neurosci. 2021. PMID: 33967697 Free PMC article. - A model for the induction of autism in the ecosystem of the human body: the anatomy of a modern pandemic?
Bilbo SD, Nevison CD, Parker W. Bilbo SD, et al. Microb Ecol Health Dis. 2015 Jan 28;26:26253. doi: 10.3402/mehd.v26.26253. eCollection 2015. Microb Ecol Health Dis. 2015. PMID: 25634608 Free PMC article. - Gut Microbiota to Microglia: Microbiome Influences Neurodevelopment in the CNS.
Bettag J, Goldenberg D, Carter J, Morfin S, Borsotti A, Fox J, ReVeal M, Natrop D, Gosser D, Kolli S, Jain AK. Bettag J, et al. Children (Basel). 2023 Oct 31;10(11):1767. doi: 10.3390/children10111767. Children (Basel). 2023. PMID: 38002858 Free PMC article. Review.
References
- Akiyama H, McGeer PL. Brain microglia constitutively express beta-2 integrins. J Neuroimmunol. 1990;30:81–93. - PubMed
- Biber K, Neumann H, Inoue K, Boddeke HW. Neuronal 'On' and 'Off' signals control microglia. Trends Neurosci. 2007;30:596–602. - PubMed
- Bishop DL, Misgeld T, Walsh MK, Gan WB, Lichtman JW. Axon branch removal at developing synapses by axosome shedding. Neuron. 2004;44:651–661. - PubMed
Publication types
MeSH terms
Substances
Grants and funding
- F32-NS-066698/NS/NINDS NIH HHS/United States
- R01-DA-15043/DA/NIDA NIH HHS/United States
- R01 DA015043/DA/NIDA NIH HHS/United States
- F32 NS066698/NS/NINDS NIH HHS/United States
- R01-NS-32151/NS/NINDS NIH HHS/United States
- P30 HD018655/HD/NICHD NIH HHS/United States
- T32 MH020017/MH/NIMH NIH HHS/United States
- P30-HD-18655/HD/NICHD NIH HHS/United States
- R01-NS-07100801/NS/NINDS NIH HHS/United States
- R01 NS032151/NS/NINDS NIH HHS/United States
- R01 NS071008/NS/NINDS NIH HHS/United States
- R01 NS045500/NS/NINDS NIH HHS/United States
- R01-NS-045500/NS/NINDS NIH HHS/United States
LinkOut - more resources
Full Text Sources
Other Literature Sources
Molecular Biology Databases
Miscellaneous


