Loss of mucosal CD103+ DCs and IL-17+ and IL-22+ lymphocytes is associated with mucosal damage in SIV infection - PubMed (original) (raw)
doi: 10.1038/mi.2012.38. Epub 2012 May 30.
J D Estes, X Sun, A M Ortiz, J S Barber, L D Harris, B Cervasi, L K Yokomizo, L Pan, C L Vinton, B Tabb, L A Canary, Q Dang, V M Hirsch, G Alter, Y Belkaid, J D Lifson, G Silvestri, J D Milner, M Paiardini, E K Haddad, J M Brenchley
Affiliations
- PMID: 22643849
- PMCID: PMC3443541
- DOI: 10.1038/mi.2012.38
Loss of mucosal CD103+ DCs and IL-17+ and IL-22+ lymphocytes is associated with mucosal damage in SIV infection
N R Klatt et al. Mucosal Immunol. 2012 Nov.
Abstract
Human immunodeficiency virus (HIV) and Simian immunodeficiency virus (SIV) disease progression is associated with multifocal damage to the gastrointestinal tract epithelial barrier that correlates with microbial translocation and persistent pathological immune activation, but the underlying mechanisms remain unclear. Investigating alterations in mucosal immunity during SIV infection, we found that damage to the colonic epithelial barrier was associated with loss of multiple lineages of interleukin (IL)-17-producing lymphocytes, cells that microarray analysis showed expressed genes important for enterocyte homeostasis, including IL-22. IL-22-producing lymphocytes were also lost after SIV infection. Potentially explaining coordinate loss of these distinct populations, we also observed loss of CD103+ dendritic cells (DCs) after SIV infection, which associated with the loss of IL-17- and IL-22-producing lymphocytes. CD103+ DCs expressed genes associated with promotion of IL-17/IL-22+ cells, and coculture of CD103+ DCs and naïve T cells led to increased IL17A and RORc expression in differentiating T cells. These results reveal complex interactions between mucosal immune cell subsets providing potential mechanistic insights into mechanisms of mucosal immune dysregulation during HIV/SIV infection, and offer hints for development of novel therapeutic strategies to address this aspect of AIDS virus pathogenesis.
Figures
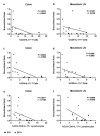
Figure 1. Loss of IL-17-producing lymphocytes correlates with damage to the tight epithelial barrier of the colon
The frequency of IL-17-producing CD4+ T cells in (a) colon, and (b) MLNs, IL-17-producing CD8+ T cells in (c) colon, and (d) MLNs, and IL-17-producing CD3-CD8+ lymphocytes in (e) colon and (f) MLNs were compared to the extent of damage to the structural barrier of the colonic epithelium as measured by the breach (no claudin) to intact (claudin) ratio. Circles, SIV-; Triangles, SIV+. Diagonal lines represent linear regression.
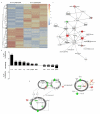
Figure 2. IL-17-producing lymphocytes upregulate genes essential for mucosal homeostasis
(a) The top 200 genes based on P value for the greatest contrast between IL17+ and IL17− lymphocytes from MLNs of SIV-uninfected RM. The complete linkage method was used for hierarchical cluster analysis. Both rows and columns are clustered. Each row represents normalized expression value for a single gene, and each column represents a sample (data are based upon RNA extractions from IL17+ lymphocytes from 2 SIV-uninfected RM, left, and IL17− lymphocytes from 3 SIV-uninfected RM, right). (b) Fold change of selected genes that were up-regulated by IL-17+ lymphocytes (top) or IL-17− lymphocytes (bottom). P values donated above each gene fold change. (c-d) The network (c) and pathway (d) from IPA analysis for selected genes is shown. Red indicates up-regulation (fold change >= 1.5); green indicates down-regulation (fold change <= −1.5); grey indicates genes whose expression values are between −1.5 and 1.5. (c) Shape: triangle represents kinase; square represents cytokine; rectangle represents ligand-dependent nuclear receptor; diamond represents enzyme; trapezoid represents transporter; ellipse represents transcription regulator; circle represents others.
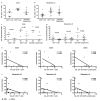
Figure 3. IL-17-producing lymphocytes produce IL-22, and IL-22-producing lymphocytes are lost after SIV infection and associated with mucosal barrier integrity
(a-b) The frequency of IL-22+ cells within IL-17-producing CD4+ T cells (left), CD8+ T cells (center) and CD3-CD8+ lymphocytes (right) in (a) colon, and (b) MLNs. (c-d) The frequency of IL-22-producing CD4+ T cells (left), CD8+ T cells (center) and CD3-CD8+ lymphocytes (right) in uninfected (circles) or SIV-infected (triangles) RMs in (c) colon and (d) MLNs. (e-f) The frequency of IL-22-producing CD4+ T cells (left), CD8+ T cells (center) and CD3-CD8+ lymphocytes (right) in (e) colon and (f) MLNs were compared to damage to the structural barrier of the colon as measured by the breach (no claudin) to intact (claudin) ratio. Closed circles, SIV− colon; closed triangles, SIV+ colon; open circles, SIV− MLNs; open triangles, SIV+ MLNs. Horizontal bars represent median, diagonal lines represent linear regression.
Figure 4. CD103+ DCs are lost after SIV infection, and associated with the frequency of IL-17 and IL-22-producing lymphocytes
(a-b) The frequency of live, lineage-, HLA-DR+ CD103+ DCs in the colon (a) or MLNs (b). (c-e) The frequency of CD103+ DCs is compared to the frequency of IL-17-producing CD4+ T cells (c), CD8+ T cells (d) or CD3-CD8+ lymphocytes (e). The frequency of CD103+ DCs is compared to the frequency of IL-22-producing CD4+ T cells (c), CD8+ T cells (d) or CD3-CD8+ lymphocytes (e). Closed circles, SIV− colon; closed triangles, SIV+ colon; open circles, SIV− MLNs; open triangles, SIV+ MLNs. Horizontal bars represent median, diagonal lines represent linear regression.
Figure 5. CD103+ DCs upregulate IL-17 promoting genes
(a) The top 200 genes based on P value for the contrast between CD103+CD11c DCs and CD103-CD11c+ DCs from MLNs of SIV-uninfected RM. The complete linkage method was used for hierarchical cluster analysis. Both rows and columns are clustered. Each row represents normalized expression value for a single gene, and each column represents a sample (data are from MLS of 3 SIV-uninfected animals and CD103+CD11c− DCs are left and CD103-CD11c+ DCs are right). (b) Fold change of selected genes that were upregulated in CD103+ DCs (top) or CD103-CD11c+ DCs (bottom). P values donated above each gene fold change. (c) The network from IPA analysis for selected genes is shown. Color: red indicates up-regulation (fold change >= 1.5); green indicates down-regulation (fold change <= −1.5); grey indicates the genes whose expression values are between −1.5 and 1.5. Shape: triangle represents kinase; square represents cytokine; rectangle represents ligand-dependent nuclear receptor; diamond represents enzyme; trapezoid represents transporter; ellipse represents transcription regulator; circle represents others.
Figure 6. CD103+ DCs directly promote IL17A and RORc expression by naïve CD4+ T cells
Naïve CD4+ T cells were co-cultured under Th17 conditions with stimulatory anti-CD3 beads alone (control), with CD103+ DCs, or with CD103− DCs in the presence of IL-6 (a, c) or absence of IL-6 (b, d). Gene expression for IL17A (a-b) and RORc (c-d) was measured by ΔΔCt compared to controls. Cells were sorted from live, SIV− rhesus macaque mesenteric lymph nodes. Rh1 and Rh2 designate the two rhesus macaques used for this experiment.
Similar articles
- IL-17-producing innate lymphoid cells are restricted to mucosal tissues and are depleted in SIV-infected macaques.
Xu H, Wang X, Liu DX, Moroney-Rasmussen T, Lackner AA, Veazey RS. Xu H, et al. Mucosal Immunol. 2012 Nov;5(6):658-69. doi: 10.1038/mi.2012.39. Epub 2012 Jun 6. Mucosal Immunol. 2012. PMID: 22669579 Free PMC article. - Maintenance of intestinal Th17 cells and reduced microbial translocation in SIV-infected rhesus macaques treated with interleukin (IL)-21.
Pallikkuth S, Micci L, Ende ZS, Iriele RI, Cervasi B, Lawson B, McGary CS, Rogers KA, Else JG, Silvestri G, Easley K, Estes JD, Villinger F, Pahwa S, Paiardini M. Pallikkuth S, et al. PLoS Pathog. 2013;9(7):e1003471. doi: 10.1371/journal.ppat.1003471. Epub 2013 Jul 4. PLoS Pathog. 2013. PMID: 23853592 Free PMC article. - Loss of Function of Intestinal IL-17 and IL-22 Producing Cells Contributes to Inflammation and Viral Persistence in SIV-Infected Rhesus Macaques.
Ryan ES, Micci L, Fromentin R, Paganini S, McGary CS, Easley K, Chomont N, Paiardini M. Ryan ES, et al. PLoS Pathog. 2016 Feb 1;12(2):e1005412. doi: 10.1371/journal.ppat.1005412. eCollection 2016 Feb. PLoS Pathog. 2016. PMID: 26829644 Free PMC article. - The Hitchhiker Guide to CD4+ T-Cell Depletion in Lentiviral Infection. A Critical Review of the Dynamics of the CD4+ T Cells in SIV and HIV Infection.
Le Hingrat Q, Sereti I, Landay AL, Pandrea I, Apetrei C. Le Hingrat Q, et al. Front Immunol. 2021 Jul 21;12:695674. doi: 10.3389/fimmu.2021.695674. eCollection 2021. Front Immunol. 2021. PMID: 34367156 Free PMC article. - New Th17-specific therapeutic strategies for HIV remission.
Planas D, Routy JP, Ancuta P. Planas D, et al. Curr Opin HIV AIDS. 2019 Mar;14(2):85-92. doi: 10.1097/COH.0000000000000522. Curr Opin HIV AIDS. 2019. PMID: 30543544 Review.
Cited by
- A Double Edged Sword Role of Interleukin-22 in Wound Healing and Tissue Regeneration.
Arshad T, Mansur F, Palek R, Manzoor S, Liska V. Arshad T, et al. Front Immunol. 2020 Sep 17;11:2148. doi: 10.3389/fimmu.2020.02148. eCollection 2020. Front Immunol. 2020. PMID: 33042126 Free PMC article. Review. - Gut barrier structure, mucosal immunity and intestinal microbiota in the pathogenesis and treatment of HIV infection.
Tincati C, Douek DC, Marchetti G. Tincati C, et al. AIDS Res Ther. 2016 Apr 11;13:19. doi: 10.1186/s12981-016-0103-1. eCollection 2016. AIDS Res Ther. 2016. PMID: 27073405 Free PMC article. Review. - Residual immune dysregulation syndrome in treated HIV infection.
Lederman MM, Funderburg NT, Sekaly RP, Klatt NR, Hunt PW. Lederman MM, et al. Adv Immunol. 2013;119:51-83. doi: 10.1016/B978-0-12-407707-2.00002-3. Adv Immunol. 2013. PMID: 23886064 Free PMC article. Review. - Women for science and science for women: Gaps, challenges and opportunities towards optimizing pre-exposure prophylaxis for HIV-1 prevention.
Karim QA, Archary D, Barré-Sinoussi F, Broliden K, Cabrera C, Chiodi F, Fidler SJ, Gengiah TN, Herrera C, Kharsany ABM, Liebenberg LJP, Mahomed S, Menu E, Moog C, Scarlatti G, Seddiki N, Sivro A, Cavarelli M. Karim QA, et al. Front Immunol. 2022 Dec 6;13:1055042. doi: 10.3389/fimmu.2022.1055042. eCollection 2022. Front Immunol. 2022. PMID: 36561760 Free PMC article. Review. - Lymph Node Cellular and Viral Dynamics in Natural Hosts and Impact for HIV Cure Strategies.
Huot N, Bosinger SE, Paiardini M, Reeves RK, Müller-Trutwin M. Huot N, et al. Front Immunol. 2018 Apr 19;9:780. doi: 10.3389/fimmu.2018.00780. eCollection 2018. Front Immunol. 2018. PMID: 29725327 Free PMC article. Review.
References
- Brenchley JM, et al. Microbial translocation is a cause of systemic immune activation in chronic HIV infection. Nat Med. 2006;12:1365–1371. - PubMed
- Brenchley JM, Price DA, Douek DC. HIV disease: fallout from a mucosal catastrophe? Nat Immunol. 2006;7:235–239. - PubMed
Publication types
MeSH terms
Substances
Grants and funding
- ZIA AI001029/ImNIH/Intramural NIH HHS/United States
- R01 AI-084836/AI/NIAID NIH HHS/United States
- Z99 AI999999/ImNIH/Intramural NIH HHS/United States
- HHSN261200800001C/RC/CCR NIH HHS/United States
- R01 AI084836/AI/NIAID NIH HHS/United States
- HHSN261200800001E/CA/NCI NIH HHS/United States
LinkOut - more resources
Full Text Sources
Other Literature Sources
Research Materials
Miscellaneous


