Inhibition of S-phase kinase-associated protein 2 (Skp2) reprograms and converts diabetogenic T cells to Foxp3+ regulatory T cells - PubMed (original) (raw)
Inhibition of S-phase kinase-associated protein 2 (Skp2) reprograms and converts diabetogenic T cells to Foxp3+ regulatory T cells
Ding Wang et al. Proc Natl Acad Sci U S A. 2012.
Abstract
Autoreactive pathogenic T cells (Tpaths) and regulatory T cells (Tregs) express a distinct gene profiles; however, the genes and associated genetic/signaling pathways responsible for the functional determination of Tpaths vs. Tregs remain unknown. Here we show that Skp2, an E3 ubiquitin ligase that affects cell cycle control and death, plays a critical role in the function of diabetogenic Tpaths and Tregs. Down-regulation of Skp2 in diabetogenic Tpaths converts them into Foxp3-expressing Tregs. The suppressive function of the Tpath-converted Tregs is dependent on increased production of TGF-β/IL-10, and these Tregs are able to inhibit spontaneous diabetes in NOD mice. Like naturally arising Foxp3(+) nTregs, the converted Tregs are anergic cells with decreased proliferation and activation-induced cell death. Skp2 down-regulation leads to Tpath-Treg conversion due at least in part to up-regulation of several genes involved in cell cycle control and genes in the Foxo family. Down-regulation of the cyclin-dependent kinase inhibitor p27 alone significantly attenuates the effect of Skp2 on Tpaths and reduces the suppressive function of converted Tregs; its effect is further improved with concomitant down-regulation of p21, Foxo1, and Foxo3. In comparison, Skp2 overexpression does not change Tpath function, but significantly decreases Foxp3 expression and abrogates the suppressive function of nTregs. These findings support the critical role of Skp2 in functional specification of Tpaths and Tregs, and demonstrate an important molecular mechanism mediating Skp2 function in balancing immune tolerance during autoimmune disease development.
Conflict of interest statement
The authors declare no conflict of interest.
Figures
Fig. 1.
BDC cells acquired potent suppressive function in vitro after Skp2 knockdown. (A) Inverse expression of Foxp3 and Skp2 in CD4+GFP+ Tregs and CD4+GFP− non-Tregs analyzed by real-time PCR. CD4+Foxp3+ Tregs were GFP+ cells purified from Foxp3/GFP reporter NOD mice (36). Results shown are the gene expression levels relative to that of the endogenous β-actin gene. Data are mean ± SD. n > 3, with each experiment run in triplicate. **P < 0.01; ***P < 0.005. (B and C) BDC-shSkp2 cells, but not control cells, were able to suppress proliferation of 3H-thymidine-labeled (B) or CFSE-labeled (C) CD4+ target T cells in response to activation by p79 plus APCs. Data in B are mean ± SD from at least three measurements, each in triplicate. ***P < 0.005. In C, representative results of three independent experiments are shown. (D) Suppression of CD4+ target T cells with BDC-shSkp2 cells at various Treg/target cell ratios. Data are mean ± SD from at least three measurements, each in triplicate. *P < 0.05; **P < 0.01; ***P < 0.005. (E) Suppressive function assays in transwells in which target cells and Tregs were physically separated. Representative results of three independent experiments are shown.
Fig. 2.
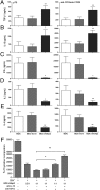
Down-regulation of Skp2 led to significantly increased TGF-β and IL-10 production by BDC-shSkp2 cells. (A–E) BDC-shSkp2 cells and control cells were activated with either p79 plus irradiated APCs or anti-CD3/CD28 antibodies for 24 h. Cell culture supernatant was harvested for ELISA of TGF-β (A), IL-10 (B), IFN-γ (C), IL-2 (D), or IL-4 (E). Data are mean ± SD from at least three measurements, each in triplicate. (F) Blockade of BDC-shSkp2 cells’ suppressive function by anti–TGF-β and anti–IL-10. Data are mean ± SD from at least three measurements, each in triplicate.
Fig. 3.
BDC-shSkp2 cells were able to inhibit spontaneous T1D in NOD mice. (A) BDC-shSkp2 cells can inhibit spontaneous T1D in NOD recipient mice. Six-wk-old female NOD mice received a single i.v. injection of 1 × 10⁷ BDC, BDC-Scrm, or BDC-shSkp2 cells. Recipient mice were monitored for up to age 30 wk and were considered diabetic after 2 consecutive weeks of glycosuria ≥2% and blood glucose level ≥250 mg/dL. (B) Histological analyses of pancreatic sections from 23-wk-old NOD recipient mice. Images are representative of sections from at least three mice per group.
Fig. 4.
Skp2 knockdown in BDC cells decreases cell proliferation and activation-induced cell death. (A) BDC-shSkp2 cells and control cells were activated with anti-CD3/CD28, and their proliferation was measured in a 4-d assay. Data are mean ± SD from at least three measurements, each in triplicate. (B) Indicated cells either untreated (0 h) or treated with anti-TCR/CD28 were cultured for 6, 12, and 24 h. Cell death was measured by annexin V and propidium iodide staining. Similar results were obtained from three independent experiments. (C) Surface expression of Fas or FasL after activation for 6, 12, and 24 h by anti-TCR/CD28. Data are mean ± SD from at least three measurements, each in triplicate.
Fig. 5.
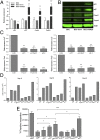
Inhibition of p21, p27, Foxo1, and Foxo3 expression restored cell proliferation and abolished suppressive function of BDC-shSkp2 cells.(A) Expression of indicated genes in BDC-shSkp2 cells and control cells. Results shown are the gene expression levels relative to that of the endogenous β-actin gene, normalized to the results from the BDC-Scrm cells. Data are mean ± SD from at least three measurements, each in triplicate. (B) Western blot analyses of indicated protein expression in BDC-shSkp2 cells and control cells. (C) Expression of shRNAs against p21, p27, Foxo1, or Foxo3 either alone or in various combinations reduced their expression by ∼80% in BDC-shSkp2 cells. Results shown are expression levels of the indicated genes relative to that of the β-actin gene, normalized to their expression in BDC-shSkp2 cells expressing scrambled shRNA. Data are mean ± SD from at least three measurements each in triplicate. (D) Proliferation of BDC-shSkp2 cells was restored to varying degrees after reduced expression of p21, p27, Foxo1, and/or Foxo3. Cell proliferation was determined by trypan blue staining at 16, 32, and 40 d after cell culture. Data are means from two independent measurements, each in triplicate. (E) The suppressive function of BDC-shSkp2 cells was blocked to varying degrees after reduced expression of p21, p27, Foxo1, and/or Foxo3. Data are mean ± SD from at least three measurements, each in triplicate.
Fig. 6.
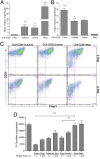
Overexpression of Skp2 in CD4+CD25+ nTregs led to decreased expression of Foxp3 and loss of regulatory function. (A and B) Expression of Skp2 and Foxp3 on day 6 after cell culture was determined by real-time PCR in freshly isolated (fresh) or cultured (cultured) CD4+CD25+ nTregs or in cultured nTregs expressing an empty control vector (control) or a vector containing Skp2 cDNA (Skp2). Results shown are expression levels of Skp2 or Foxp3 relative to β-actin gene expression, normalized to those in freshly isolated nTregs (A) or Skp2-overexpressing nTreg/Skp2 cells (B). Data are mean ± SD from at least three measurements, each in triplicate. (C) Overexpression of Skp2 led to faster loss of Foxp3+ cells in CD4+CD25+/Skp2 cells than in CD4+CD25+/cultured and CD4+CD25+/control cells on day 3 and day 6 after cell culture. Results shown are representative of three independent experiments. (D) Overexpression of Skp2 abolished the function of nTregs in suppressing CD4+CD25− target cells. Data are mean ± SD from at least three measurements, each in triplicate.
Similar articles
- Killer cell Ig-like receptor (KIR) 3DL1 down-regulation enhances inhibition of type 1 diabetes by autoantigen-specific regulatory T cells.
Qin H, Wang Z, Du W, Lee WH, Wu X, Riggs AD, Liu CP. Qin H, et al. Proc Natl Acad Sci U S A. 2011 Feb 1;108(5):2016-21. doi: 10.1073/pnas.1019082108. Epub 2011 Jan 18. Proc Natl Acad Sci U S A. 2011. PMID: 21245333 Free PMC article. - Self-Transducible Bimodal PDX1-FOXP3 Protein Lifts Insulin Secretion and Curbs Autoimmunity, Boosting Tregs in Type 1 Diabetic Mice.
Amatya C, Radichev IA, Ellefson J, Williams M, Savinov AY. Amatya C, et al. Mol Ther. 2018 Jan 3;26(1):184-198. doi: 10.1016/j.ymthe.2017.08.014. Epub 2017 Sep 7. Mol Ther. 2018. PMID: 28988715 Free PMC article. - Distinct regulatory roles of transforming growth factor-beta and interleukin-4 in the development and maintenance of natural and induced CD4+ CD25+ Foxp3+ regulatory T cells.
Prochazkova J, Fric J, Pokorna K, Neuwirth A, Krulova M, Zajicova A, Holan V. Prochazkova J, et al. Immunology. 2009 Sep;128(1 Suppl):e670-8. doi: 10.1111/j.1365-2567.2009.03060.x. Epub 2009 Jan 24. Immunology. 2009. PMID: 19740328 Free PMC article. - FOXP3+ regulatory T cells: control of FOXP3 expression by pharmacological agents.
Ohkura N, Hamaguchi M, Sakaguchi S. Ohkura N, et al. Trends Pharmacol Sci. 2011 Mar;32(3):158-66. doi: 10.1016/j.tips.2010.12.004. Epub 2011 Jan 13. Trends Pharmacol Sci. 2011. PMID: 21237521 Review. - FOXP3+ regulatory T cells: from suppression of rejection to induction of renal allograft tolerance.
Dummer CD, Carpio VN, Gonçalves LF, Manfro RC, Veronese FV. Dummer CD, et al. Transpl Immunol. 2012 Jan;26(1):1-10. doi: 10.1016/j.trim.2011.08.009. Epub 2011 Sep 13. Transpl Immunol. 2012. PMID: 21939765 Review.
Cited by
- Induction of regulatory T cells by high-dose gp96 suppresses murine liver immune hyperactivation.
Li X, Liu Z, Yan X, Zhang X, Li Y, Zhao B, Wang S, Zhou X, Gao GF, Meng S. Li X, et al. PLoS One. 2013 Jul 18;8(7):e68997. doi: 10.1371/journal.pone.0068997. Print 2013. PLoS One. 2013. PMID: 23874845 Free PMC article. - Regulation of inflammation and immunity in sepsis by E3 ligases.
Shao S, Zhou D, Feng J, Liu Y, Baturuhu, Yin H, Zhan D. Shao S, et al. Front Endocrinol (Lausanne). 2023 Jul 3;14:1124334. doi: 10.3389/fendo.2023.1124334. eCollection 2023. Front Endocrinol (Lausanne). 2023. PMID: 37465127 Free PMC article. Review. - Non-classical Vitamin D Actions for Renal Protection.
Dusso AS, Bauerle KT, Bernal-Mizrachi C. Dusso AS, et al. Front Med (Lausanne). 2021 Dec 7;8:790513. doi: 10.3389/fmed.2021.790513. eCollection 2021. Front Med (Lausanne). 2021. PMID: 34950686 Free PMC article. Review. - Expression of proliferation-related genes in BM-MSC-treated ALL cells in hypoxia condition is regulated under the influence of epigenetic factors in-vitro.
Yang X, Wang Y, Rahman HS, Mohammad TAM, Sorkhabi AD, Korsakov SE, Thangavelu L, Adili A, Sarkesh A, Tamjidifar R, Saeedi H, Aslaminabad R, Tarzi S, Akbari M. Yang X, et al. Med Oncol. 2022 May 18;39(5):88. doi: 10.1007/s12032-022-01671-6. Med Oncol. 2022. PMID: 35581482 - Gene Expression Analysis Reveals Novel Shared Gene Signatures and Candidate Molecular Mechanisms between Pemphigus and Systemic Lupus Erythematosus in CD4+ T Cells.
Sezin T, Vorobyev A, Sadik CD, Zillikens D, Gupta Y, Ludwig RJ. Sezin T, et al. Front Immunol. 2018 Jan 17;8:1992. doi: 10.3389/fimmu.2017.01992. eCollection 2017. Front Immunol. 2018. PMID: 29387060 Free PMC article.
References
- Haskins K, McDuffie M. Acceleration of diabetes in young NOD mice with a CD4+ islet-specific T cell clone. Science. 1990;249:1433–1436. - PubMed
- Katz JD, Wang B, Haskins K, Benoist C, Mathis D. Following a diabetogenic T cell from genesis through pathogenesis. Cell. 1993;74:1089–1100. - PubMed
- Sakaguchi S, Powrie F. Emerging challenges in regulatory T cell function and biology. Science. 2007;317:627–629. - PubMed
- Vieira PL, et al. IL-10–secreting regulatory T cells do not express Foxp3 but have comparable regulatory function to naturally occurring CD4+CD25+ regulatory T cells. J Immunol. 2004;172:5986–5993. - PubMed
Publication types
MeSH terms
Substances
LinkOut - more resources
Full Text Sources
Other Literature Sources
Molecular Biology Databases
Research Materials
Miscellaneous


