The intrinsic connectivity distribution: a novel contrast measure reflecting voxel level functional connectivity - PubMed (original) (raw)
The intrinsic connectivity distribution: a novel contrast measure reflecting voxel level functional connectivity
D Scheinost et al. Neuroimage. 2012 Sep.
Abstract
Resting-state fMRI (rs-fMRI) holds promise as a clinical tool to characterize and monitor the phenotype of different neurological and psychiatric disorders. The most common analysis approach requires the definition of one or more regions-of-interest (ROIs). However this need for a priori ROI information makes rs-fMRI inadequate to survey functional connectivity differences associated with a range of neurological disorders where the ROI information may not be available. A second problem encountered in fMRI measures of connectivity is the need for an arbitrary correlation threshold to determine whether or not two areas are connected. This is problematic because in many cases the differences in tissue connectivity between disease groups and/or control subjects are threshold dependent. In this work we propose a novel voxel-based contrast mechanism for rs-fMRI, the intrinsic connectivity distribution (ICD), that neither requires a priori information to define a ROI, nor an arbitrary threshold to define a connection. We show the sensitivity of previous methods to the choice of connection thresholds and evaluate ICD using a survey study comparing young adults born prematurely to healthy term control subjects. Functional connectivity differences were found in hypothesized language processing areas in the left temporal-parietal areas. In addition, significant clinically-relevant differences were found between preterm and term control subjects, highlighting the importance of whole brain surveys independent of a priori information.
Copyright © 2012 Elsevier Inc. All rights reserved.
Figures
Figure 1
A) An example distribution of connection strengths and its corresponding survival curve. The red area of the connection strengths distribution represents ICC-d at an arbitrary threshold. This area maps to a single point on survival curve, d(x,τ). ICD parameterizes the survival curve eliminating the need for thresholds. B-C) The ICD parameterization is monotonically decreasing (an important property of any survival curve) and is capable of capturing a variety of shapes with only two parameters (α and β). The varied shape of the curves illustrates the sensitivity to threshold for degree based measures. B) The blue and green survival curves have the same β parameter but the blue curve has a smaller α parameter and a larger degree metric at any threshold. The red curve represents the difference between the survival curves and peaks at approximately τ=0.35. C) The blue and green survival curves have the same α parameter but the blue curve has a larger β parameter and a larger degree metric at any threshold. The red curve represents the difference between the survival curves and peaks at approximately τ=0.13.
Figure 2
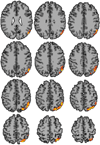
ICC-d revealed group differences between preterm and term subjects in the temporal-parietal area. Results from a range of threshold from τ=0.15 to τ=0.7 are shown. While the temporal-parietal area consistently showed group differences, specific regions (such as BA 40 and BA 19) were inconsistent over the different thresholds. Additionally, the clusters in the right and left inferior temporal lobe are not detected at higher thresholds. The circles highlight regions that show changes when the threshold is increased by 0.05.
Figure 3
ICC-p revealed group difference between preterm and term subjects in the hypothesized temporal-parietal lobe only at thresholds between τ=0.55 (not shown) and τ=0.60 (shown). ICC-p did detect group differences in the inferior temporal lobes or medial frontal lobes at any threshold.
Figure 4
Weighted Global Brain Connectivity (shown at three different thresholds) performed similarly to ICC-p in detecting group difference but was less sensitive to threshold effects. However, wGBC detected fewer group differences then ICC-d (over a variety of thresholds) and ICD-α.
Figure 5
The threshold dependency of ICC-d can cause ambiguous results if the survival functions from two populations cross. The average survival functions from the white circle in (B-D) are shown in (A). These curves cross at approximately τ=0.15. Group results as produced by ICC-d at p<0.05 uncorrected using threshold (B) τ=0.05, (C) τ=0.15, and (D) τ=0.55 are shown. The direction of the differences changes as predicted by the survival functions.
Figure 6
The proposed ICD-α revealed significant difference between preterm and tern subject at age 20 using resting state fMRI in a whole-brain survey study. This method detected four clusters increased functional connectivity for the preterm group when compared to the term group. The first cluster is centered in the left temporal-parietal area in known language processing areas including BA 39 and BA 40. The second and third clusters are located in the right and left inferior temporal lobe. The fourth cluster is located in the medial frontal lobe.
Figure 7
Coefficient of Determination (R2) illustrating that ICD provides a good fit of the degree curve throughout both cortical and sub-cortical gray matter. The mean coefficient of determination is 0.78 with a standard deviation of 0.17 in the gray matter.
Figure 8
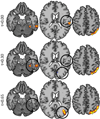
ICC-d, ICC-p, wGBC, and ICD-α results shown on the same axial slices with a τ=0.25 for ICC-d, ICC-p, and wGBC. The regions highlighted by the black circle are detected at p<0.05 corrected only for ICD-α. However, when the significance level is relaxed, all show similar results in these areas.
Similar articles
- Coupled Intrinsic Connectivity Distribution analysis: a method for exploratory connectivity analysis of paired FMRI data.
Scheinost D, Shen X, Finn E, Sinha R, Constable RT, Papademetris X. Scheinost D, et al. PLoS One. 2014 Mar 27;9(3):e93544. doi: 10.1371/journal.pone.0093544. eCollection 2014. PLoS One. 2014. PMID: 24676034 Free PMC article. - A whole-brain voxel based measure of intrinsic connectivity contrast reveals local changes in tissue connectivity with anesthetic without a priori assumptions on thresholds or regions of interest.
Martuzzi R, Ramani R, Qiu M, Shen X, Papademetris X, Constable RT. Martuzzi R, et al. Neuroimage. 2011 Oct 15;58(4):1044-50. doi: 10.1016/j.neuroimage.2011.06.075. Epub 2011 Jul 2. Neuroimage. 2011. PMID: 21763437 Free PMC article. - A left cerebellar pathway mediates language in prematurely-born young adults.
Constable RT, Vohr BR, Scheinost D, Benjamin JR, Fulbright RK, Lacadie C, Schneider KC, Katz KH, Zhang H, Papademetris X, Ment LR. Constable RT, et al. Neuroimage. 2013 Jan 1;64:371-8. doi: 10.1016/j.neuroimage.2012.09.008. Epub 2012 Sep 12. Neuroimage. 2013. PMID: 22982585 Free PMC article. Clinical Trial. - Resting-state fMRI functional connectivity: a new perspective to evaluate pain modulation in migraine?
Colombo B, Rocca MA, Messina R, Guerrieri S, Filippi M. Colombo B, et al. Neurol Sci. 2015 May;36 Suppl 1:41-5. doi: 10.1007/s10072-015-2145-x. Neurol Sci. 2015. PMID: 26017510 Review. - A survey on applications and analysis methods of functional magnetic resonance imaging for Alzheimer's disease.
Forouzannezhad P, Abbaspour A, Fang C, Cabrerizo M, Loewenstein D, Duara R, Adjouadi M. Forouzannezhad P, et al. J Neurosci Methods. 2019 Apr 1;317:121-140. doi: 10.1016/j.jneumeth.2018.12.012. Epub 2018 Dec 26. J Neurosci Methods. 2019. PMID: 30593787 Review.
Cited by
- A molecular-genetic and imaging-genetic approach to specific comprehension difficulties in children.
Li M, Malins JG, DeMille MMC, Lovett MW, Truong DT, Epstein K, Lacadie C, Mehta C, Bosson-Heenan J, Gruen JR, Frijters JC; GRaD Study Consortium. Li M, et al. NPJ Sci Learn. 2018 Nov 21;3:20. doi: 10.1038/s41539-018-0034-9. eCollection 2018. NPJ Sci Learn. 2018. PMID: 30631481 Free PMC article. - Bayesian Community Detection in the Space of Group-Level Functional Differences.
Venkataraman A, Yang DY, Pelphrey KA, Duncan JS. Venkataraman A, et al. IEEE Trans Med Imaging. 2016 Aug;35(8):1866-82. doi: 10.1109/TMI.2016.2536559. Epub 2016 Mar 2. IEEE Trans Med Imaging. 2016. PMID: 26955022 Free PMC article. - Sex differences in normal age trajectories of functional brain networks.
Scheinost D, Finn ES, Tokoglu F, Shen X, Papademetris X, Hampson M, Constable RT. Scheinost D, et al. Hum Brain Mapp. 2015 Apr;36(4):1524-35. doi: 10.1002/hbm.22720. Epub 2014 Dec 18. Hum Brain Mapp. 2015. PMID: 25523617 Free PMC article. - The impact of image smoothness on intrinsic functional connectivity and head motion confounds.
Scheinost D, Papademetris X, Constable RT. Scheinost D, et al. Neuroimage. 2014 Jul 15;95:13-21. doi: 10.1016/j.neuroimage.2014.03.035. Epub 2014 Mar 20. Neuroimage. 2014. PMID: 24657356 Free PMC article. - Increased amygdala and decreased frontolimbic r esting- s tate functional connectivity in children with aggressive behavior.
Sukhodolsky DG, Ibrahim K, Kalvin CB, Jordan RP, Eilbott J, Hampson M. Sukhodolsky DG, et al. Soc Cogn Affect Neurosci. 2022 Jul 2;17(7):634-644. doi: 10.1093/scan/nsab128. Soc Cogn Affect Neurosci. 2022. PMID: 34850939 Free PMC article.
References
- Biswal B, Zerrin Yetkin F, Haughton VM, Hyde JS. Functional connectivity in the motor cortex of resting human brain using echo-planar mri. Magnetic Resonance in Medicine. 1995;34:537–541. - PubMed
- Buckner RL, Sepulcre J, Talukdar T, Krienen FM, Liu H, Hedden T, Andrews-Hanna JR, Sperling RA, Johnson KA. Cortical Hubs Revealed by Intrinsic Functional Connectivity: Mapping, Assessment of Stability, and Relation to Alzheimer's Disease. The Journal of Neuroscience. 2009;29:1860–1873. - PMC - PubMed
- Cole MW, Pathak S, Schneider W. Identifying the brain's most globally connected regions. NeuroImage. 2010;49:3132–3148. - PubMed
- Constable RT, Ment LR, Vohr BR, Kesler SR, Fulbright RK, Lacadie C, Delancy S, Katz KH, Schneider KC, Schafer RJ, Makuch RW, Reiss AR. Prematurely Born Children Demonstrate White Matter Microstructural Differences at 12 Years of Age, Relative to Term Control Subjects: An Investigation of Group and Gender Effects. Pediatrics. 2008;121:306–316. - PubMed
Publication types
MeSH terms
Grants and funding
- R01 NS051622/NS/NINDS NIH HHS/United States
- R01 EB006494/EB/NIBIB NIH HHS/United States
- R01 NS027116/NS/NINDS NIH HHS/United States
- R03 EB012969/EB/NIBIB NIH HHS/United States
- R01 EB009666/EB/NIBIB NIH HHS/United States
- R01 NS027116-20/NS/NINDS NIH HHS/United States
LinkOut - more resources
Full Text Sources
Other Literature Sources


