Deep sequencing of the oral microbiome reveals signatures of periodontal disease - PubMed (original) (raw)
doi: 10.1371/journal.pone.0037919. Epub 2012 Jun 4.
Lina L Faller, Niels Klitgord, Varun Mazumdar, Mohammad Ghodsi, Daniel D Sommer, Theodore R Gibbons, Todd J Treangen, Yi-Chien Chang, Shan Li, O Colin Stine, Hatice Hasturk, Simon Kasif, Daniel Segrè, Mihai Pop, Salomon Amar
Affiliations
- PMID: 22675498
- PMCID: PMC3366996
- DOI: 10.1371/journal.pone.0037919
Deep sequencing of the oral microbiome reveals signatures of periodontal disease
Bo Liu et al. PLoS One. 2012.
Abstract
The oral microbiome, the complex ecosystem of microbes inhabiting the human mouth, harbors several thousands of bacterial types. The proliferation of pathogenic bacteria within the mouth gives rise to periodontitis, an inflammatory disease known to also constitute a risk factor for cardiovascular disease. While much is known about individual species associated with pathogenesis, the system-level mechanisms underlying the transition from health to disease are still poorly understood. Through the sequencing of the 16S rRNA gene and of whole community DNA we provide a glimpse at the global genetic, metabolic, and ecological changes associated with periodontitis in 15 subgingival plaque samples, four from each of two periodontitis patients, and the remaining samples from three healthy individuals. We also demonstrate the power of whole-metagenome sequencing approaches in characterizing the genomes of key players in the oral microbiome, including an unculturable TM7 organism. We reveal the disease microbiome to be enriched in virulence factors, and adapted to a parasitic lifestyle that takes advantage of the disrupted host homeostasis. Furthermore, diseased samples share a common structure that was not found in completely healthy samples, suggesting that the disease state may occupy a narrow region within the space of possible configurations of the oral microbiome. Our pilot study demonstrates the power of high-throughput sequencing as a tool for understanding the role of the oral microbiome in periodontal disease. Despite a modest level of sequencing (~2 lanes Illumina 76 bp PE) and high human DNA contamination (up to ~90%) we were able to partially reconstruct several oral microbes and to preliminarily characterize some systems-level differences between the healthy and diseased oral microbiomes.
Conflict of interest statement
Competing Interests: The authors have declared that no competing interests exist.
Figures
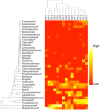
Figure 1. Relative abundance of genera in the samples estimated from 16S rDNA sequencing. * - genus significantly enriched in cases; ∧- genus significantly enriched in controls (p< = 0.05, Metastats [ 30]).
Only genera with >1% abundance in at least one sample were included. Colors reflect relative abundance from low (red) to high (white). Sample H31 (control) clusters together with the diseased samples, consistent with clinical observations of early symptoms of periodontal disease.
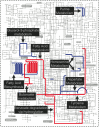
Figure 2. Metabolic pathways present in our samples.
Dark blue – significantly enriched in healthy samples (p<0.05, MetaPath [84]); Dark red– significantly enriched in diseased samples (p<0.05, MetaPath). (Figure constructed with iPath [85]).
Figure 3. Systems-level analysis reveals the disease state to occupy a narrow region within the space of possible states for the microbiome.
A – Shannon diversity calculated from 16S rDNA data is significantly higher in diseased samples (community is more diverse). B – Principal Component Analysis of the taxonomic compositions from 16S rDNA (empty symbols) and pooled WGS data (filled symbols). Disease samples cluster together in the bottom left corner. Sample H31 (tooth with incipient periodontal disease from an otherwise healthy patient) clusters together with the disease samples. C – Principal component analysis of the enzyme content of samples based on metagenomic sequencing. The PCA graph shows a tighter clustering of disease samples (red) relative to the healthy ones (blue). This suggests that the disease state may be linked to a specific metabolic configuration, and that the space of disease configurations is more constrained than the healthy one. Replicates (forward/reverse reads from one or two instrument lanes) are shown separately as identical symbols, and exhibit minimal metabolic variation within each sample. D – Comparison of relative frequencies of tetramers (4 bp motifs) in metagenomic reads across disease cases (in red, P1 vs. P2) and across control cases (in blue, H1 vs. H2). Based on the relative frequencies of tetramers, disease samples are more similar to each other (points lie along the diagonal) than controls are to each other.
Figure 4. Schematic representation of the putative metabolic lifestyle shifts associated with the change in microbial flora around the tooth and gum tissue upon the transition from a healthy (A) to an advanced periodontal disease (B) state.
The healthy state is dominated by the bacterial genera Streptococcus, Fusobacterium, Actinomyces, and Corynebacterium, whereas the disease state is primarily dominated by pathogenic genera such as Prevotella, Leptotrichia, Treponema, and Fusobacterium.
Figure 5. Comparative analysis of the Actinomyces naeslundii MG1 reference genome (HOMD SeqID SEQF1063), and assemblies from samples H1 and H2.
Counting from outside, the first ring is the reference genome with genes annotated by colored bands: orange bands are conserved genes; green bands are genes involved in horizontal gene transfer; yellow bands are genes with known functions; black bands are genes with unknown functions. Only regions that are associated with genomic variations are colored and annotated. The second and sixth rings are the assembled contigs from sample H2 and H1. The heatmaps in the third and seventh rings represent the depth of coverage of the contigs with 5K bp window and 100 bp step for sample H2 and H1. The histograms in the fourth and eighth rings represent the scaled SNP rate with 5 Kbp window and 100 bp step for sample H2 (max = 0.08) and H1 (max = 0.03). The purple bands in the fifth ring represent regions with significantly higher theta values than average (p< = 0.05). Image generated with Circos .
Similar articles
- Metagenomic sequencing reveals microbiota and its functional potential associated with periodontal disease.
Wang J, Qi J, Zhao H, He S, Zhang Y, Wei S, Zhao F. Wang J, et al. Sci Rep. 2013;3:1843. doi: 10.1038/srep01843. Sci Rep. 2013. PMID: 23673380 Free PMC article. - High-resolution ISR amplicon sequencing reveals personalized oral microbiome.
Mukherjee C, Beall CJ, Griffen AL, Leys EJ. Mukherjee C, et al. Microbiome. 2018 Sep 5;6(1):153. doi: 10.1186/s40168-018-0535-z. Microbiome. 2018. PMID: 30185233 Free PMC article. - Multi-site analysis of biosynthetic gene clusters from the periodontitis oral microbiome.
Koohi-Moghadam M, Watt RM, Leung WK. Koohi-Moghadam M, et al. J Med Microbiol. 2024 Oct;73(10). doi: 10.1099/jmm.0.001898. J Med Microbiol. 2024. PMID: 39378072 - The oral microbiome in health and disease.
Wade WG. Wade WG. Pharmacol Res. 2013 Mar;69(1):137-43. doi: 10.1016/j.phrs.2012.11.006. Epub 2012 Nov 28. Pharmacol Res. 2013. PMID: 23201354 Review.
Cited by
- Recent Advances in Functionalized Electrospun Membranes for Periodontal Regeneration.
Epicoco L, Pellegrino R, Madaghiele M, Friuli M, Giannotti L, Di Chiara Stanca B, Palermo A, Siculella L, Savkovic V, Demitri C, Nitti P. Epicoco L, et al. Pharmaceutics. 2023 Dec 4;15(12):2725. doi: 10.3390/pharmaceutics15122725. Pharmaceutics. 2023. PMID: 38140066 Free PMC article. Review. - Functional profiling in Streptococcus mutans: construction and examination of a genomic collection of gene deletion mutants.
Quivey RG Jr, Grayhack EJ, Faustoferri RC, Hubbard CJ, Baldeck JD, Wolf AS, MacGilvray ME, Rosalen PL, Scott-Anne K, Santiago B, Gopal S, Payne J, Marquis RE. Quivey RG Jr, et al. Mol Oral Microbiol. 2015 Dec;30(6):474-95. doi: 10.1111/omi.12107. Epub 2015 Jun 19. Mol Oral Microbiol. 2015. PMID: 25973955 Free PMC article. - Japanese subgingival microbiota in health vs disease and their roles in predicted functions associated with periodontitis.
Ikeda E, Shiba T, Ikeda Y, Suda W, Nakasato A, Takeuchi Y, Azuma M, Hattori M, Izumi Y. Ikeda E, et al. Odontology. 2020 Apr;108(2):280-291. doi: 10.1007/s10266-019-00452-4. Epub 2019 Sep 9. Odontology. 2020. PMID: 31502122 - Episymbiotic Saccharibacteria suppresses gingival inflammation and bone loss in mice through host bacterial modulation.
Chipashvili O, Utter DR, Bedree JK, Ma Y, Schulte F, Mascarin G, Alayyoubi Y, Chouhan D, Hardt M, Bidlack F, Hasturk H, He X, McLean JS, Bor B. Chipashvili O, et al. Cell Host Microbe. 2021 Nov 10;29(11):1649-1662.e7. doi: 10.1016/j.chom.2021.09.009. Epub 2021 Oct 11. Cell Host Microbe. 2021. PMID: 34637779 Free PMC article. - Illumina MiSeq Sequencing for Preliminary Analysis of Microbiome Causing Primary Endodontic Infections in Egypt.
Tawfik SA, Azab MM, Ahmed AAA, Fayyad DM. Tawfik SA, et al. Int J Microbiol. 2018 Apr 3;2018:2837328. doi: 10.1155/2018/2837328. eCollection 2018. Int J Microbiol. 2018. PMID: 29849646 Free PMC article.
References
- Ley RE, Peterson DA, Gordon JI. Ecological and evolutionary forces shaping microbial diversity in the human intestine. Cell. 2006;124:837–848. - PubMed
Publication types
MeSH terms
Substances
Grants and funding
- R01 DE015345/DE/NIDCR NIH HHS/United States
- R01DE015345/DE/NIDCR NIH HHS/United States
- R01-HG-04885/HG/NHGRI NIH HHS/United States
- RC2-GM-092602-01/GM/NIGMS NIH HHS/United States
- R01 HG004885/HG/NHGRI NIH HHS/United States
- R01DE014079/DE/NIDCR NIH HHS/United States
- RC2 GM092602/GM/NIGMS NIH HHS/United States
- 1RC2GM092602-01/GM/NIGMS NIH HHS/United States
- R01 DE014079/DE/NIDCR NIH HHS/United States
LinkOut - more resources
Full Text Sources
Other Literature Sources


