Functional repurposing revealed by comparing S. pombe and S. cerevisiae genetic interactions - PubMed (original) (raw)
. 2012 Jun 8;149(6):1339-52.
doi: 10.1016/j.cell.2012.04.028.
Marc G Elgort, Onn Brandman, Clinton Ives, Sean R Collins, Lakshmi Miller-Vedam, Jimena Weibezahn, Marco Y Hein, Ina Poser, Matthias Mann, Anthony A Hyman, Jonathan S Weissman
Affiliations
- PMID: 22682253
- PMCID: PMC3613983
- DOI: 10.1016/j.cell.2012.04.028
Functional repurposing revealed by comparing S. pombe and S. cerevisiae genetic interactions
Adam Frost et al. Cell. 2012.
Abstract
We present a genetic interaction map of pairwise measures including ∼40% of nonessential S. pombe genes. By comparing interaction maps for fission and budding yeast, we confirmed widespread conservation of genetic relationships within and between complexes and pathways. However, we identified an important subset of orthologous complexes that have undergone functional "repurposing": the evolution of divergent functions and partnerships. We validated three functional repurposing events in S. pombe and mammalian cells and discovered that (1) two lumenal sensors of misfolded ER proteins, the kinase/nuclease Ire1 and the glucosyltransferase Gpt1, act together to mount an ER stress response; (2) ESCRT factors regulate spindle-pole-body duplication; and (3) a membrane-protein phosphatase and kinase complex, the STRIPAK complex, bridges the cis-Golgi, the centrosome, and the outer nuclear membrane to direct mitotic progression. Each discovery opens new areas of inquiry and-together-have implications for model organism-based research and the evolution of genetic systems.
Copyright © 2012 Elsevier Inc. All rights reserved.
Figures
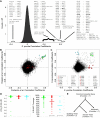
Figure 1. Dataset Overview and Reproducibility Benchmarks
(A) Functional classification of genes in the map. (B) Scatter plot comparing scores from reciprocal crosses (C) Scatter plot of correlation coefficients between genetic interaction (GI) profiles for Query versus Array pairs of strains.
Figure 2. Functional Conservation versus Functional Repurposing
(A) Distribution of correlation coefficients between GI profiles, with extreme cases of pairwise correlation and anti-correlation annotated as gene a - gene b. (B) Scatter plot of correlation coefficients comparing Sc data reported by Hoppins et al versus Costanzo et al. See Table S1 for a list of highly correlated profiles and highly reproducible (green) correlation relationships. (C) Scatter plot of correlation coefficients comparing GI profiles for Sp versus Sc. Highlighted examples of pairwise relationships that are correlated in Sp but not Sc are listed below the scatter plot. Bold indicates functional relationships explored in this study. See Table S1 for additional examples of correlated pairwise relationships conserved between Sp and Sc (green), and pairwise relationships that are correlated in Sc but not Sp (cyan) or Sp but not Sc (red). (D) Amino acid sequence comparison-based statistics for Sp versus Sc orthologs highlighted in 2B,C. Horizontal bars = median values. See Table S1 for BLAST scores, E-VALUEs, percent identities and overlap. (E) Functional Repurposing: the functions of ancestral genes are unknown, but for the factors studied here the apparent gene-to-gene and gene-to-phenotype relationships in Sp are divergent from those in Sc.
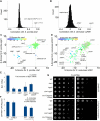
Figure 3. the UPR Depends on Gpt1/Cnx1 and Ire1
(A) Distribution of correlation coefficients for Sp Δ_ire1_ compared with (B) distribution of correlation coefficients for Sc Δ_IRE1_ (when different, names for Sc orthologs in gray text). (C) 3D scatter plot for Sp scores comparing Δ_ire1_ with Δ_gpt1_ on the x and y axes, respectively, and the calnexin ortholog, cnx1_-degron-DAmP, color coded according to the inset scale. (D) 3D scatter plot for Sc scores comparing Δ_IRE1 with Δ_HAC1_ on the x and y axes, respectively, and the non-essential calnexin ortholog, Δ_CNE1_, color coded according to the inset scale. (E) Fold induction of normalized bip1 mRNA levels by qPCR in ER stress-inducing conditions. Each bar is the mean of three biological and three technical replicates per strain per condition. (F) Fold induction of GFP/RFP ratios in cells harboring a reporter system in which a Hac1p-responsive promoter drives green fluorescent protein corrected for nonspecific expression changes by comparing GFP to co-expressed RFP from a constitutive (TEF2) promoter (Jonikas et al 2009). Error bars = S.D. (G) Growth sensitivity of the indicated Sp strains to 20mM DTT or 2.5μg/mL tunicamycin.
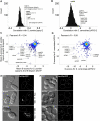
Figure 4. ESCRT-III Proteins and Vps4 Regulate Spindle Pole Body Duplication
(A) Distribution of correlation coefficients for Sp apq12 compared with (B) distribution of correlation coefficients for ScAPQ12 (when different, names for Sc orthologs shown in gray text). (C) Scatter plot of mean scores for Sp apq12 and brr6 versus mean scores for vps32, vps24 and vps4. The following Sc orthologs have different names: SPAC23C4.05c = MSC1, mik1 = SWE1, rad26 = LCD1, mis15 = CHL4, mde4 = LRS4, cut8 = STS1, kap111 = KAP122, nup97 = NIC96, mph1 = MPS1. (D) Scatter plot of mean scores for Sc APQ12 versus VPS4. (E,F) DIC and fluorescence micrographs of the indicated cells expressing constitutive spindle-pole body markers (Cut12-CFP in Sp, Spc42p-GFP in Sc). For the fragmentation/duplication phenotypes observed in Sp the percent penetrance +/− standard deviation is noted. In addition to Spc42p, an outer plaque (Cnm67p-GFP), inner plaque (Spc110p-GFP), and gamma-tubulin (Tub4p-GFP) marked strains were scored (see Fig S4).
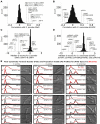
Figure 5. the FAR Complex Regulates the Cell Cycle in Fission Yeast
(A) Distribution of correlation coefficients for Sp far8 compared with (B) distribution of correlation coefficients for ScFAR8 (when different, names for Sc orthologs shown in gray text). Distribution of aggravating and alleviating _GI_s shared by the FAR complex genes in (C) Sp and (D) Sc. (E) Flow cytometry analysis showing forward scatter (FSC, top panel) and DNA content histograms (PI, bottom panel) for wild type (black) and mutant cells (red). Traces represent mean values from triplicate experiments next to corresponding DIC images of representative cells. Bars 3 μm.
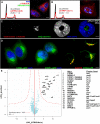
Figure 6. Striatins and STRIPs form a Complex at the Golgi that Regulates Mitosis
(A,B) Flow cytometry analysis showing DNA content histograms of HeLa cells treated with control siRNA targeting Luciferase (black) or siRNAs to deplete STRIPAK complex subunits (red). HeLa cell depletions revealing multinucleate cells and fragmented nuclei. (C) HeLa cell depleted of STRIP1 (Far11) for 48 hours. Fluorescence staining shows centrosomes (red), Golgi (green) and nuclei (blue). (D) HeLa cells harboring bacterial artificial chromosomes for eGFP-tagged STRN3 (Far8) or STRIP1 (Far11), demonstrating Golgi-like morphology and colocalization with the Golgi resident protein GIANTIN (red). See Fig S6 for additional colocalizations after siRNA depletion. (E) Volcano plot representation of STRN3-interacting proteins. For each protein identified by IP-MS, the ratio of the intensities in the STRN3 IPs over the control was calculated and plotted against the p-value of a t-test calculated from triplicates. The red curve is a cutoff calculated from false discovery rate estimation.
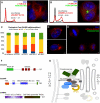
Figure 7. STRIPAK Signaling Complexes Bridge the Nuclear Envelope, Centrosomes and Golgi
(A,B) Flow cytometry analysis showing DNA content histograms of HeLa cells treated with control siRNA targeting Luciferase (black) or siRNAs to deplete SLMAP (Far10) or MOBKL3 (Mob1). HeLa cells depleted of the designated proteins and labled for immuno-fluorescence. See Fig S6 for additional images of siMOBKL3 phenotypes. (C) Fraction of interphase cells with abnormal numbers of pericentrin foci following siRNA treatment. Errors Bars = S.E.M. (D,E) HeLa cells transiently expressing mCherry-SLMAP and labeled for immuno-fluorescence. See Fig S7 for the lack of co-localization between mCherry-SLMAP and the Golgi. (F) Domain architecture of the FAR/STRIPAK components. (G) STRIPAK Model: Striatin and STRIPs reside at the Golgi. Striatins serve as regulatory B”' subunits of a PP2A trimer. Striatin/STRIP recruit MOBKL3, which directs Ste20/Germinal Center kinases. STRIPs interact with SLMAP in the outer nuclear membrane, bridging the Golgi, the centrosome, and the nuclear envelope. These interactions are likely restricted to specific cell cycle phases and the interaction between SLMAP and centrosomes predominates during mitosis. Disruption of STRIPAK leads to diverse failures during mitosis: including centrosome duplication errors, spindle assembly errors and cytokinesis failure.
Similar articles
- A complex network of interactions between mitotic kinases, phosphatases and ESCRT proteins regulates septation and membrane trafficking in S. pombe.
Bhutta MS, Roy B, Gould GW, McInerny CJ. Bhutta MS, et al. PLoS One. 2014 Oct 30;9(10):e111789. doi: 10.1371/journal.pone.0111789. eCollection 2014. PLoS One. 2014. PMID: 25356547 Free PMC article. - Mph1, a member of the Mps1-like family of dual specificity protein kinases, is required for the spindle checkpoint in S. pombe.
He X, Jones MH, Winey M, Sazer S. He X, et al. J Cell Sci. 1998 Jun;111 ( Pt 12):1635-47. doi: 10.1242/jcs.111.12.1635. J Cell Sci. 1998. PMID: 9601094 - Calmodulin localizes to the spindle pole body of Schizosaccharomyces pombe and performs an essential function in chromosome segregation.
Moser MJ, Flory MR, Davis TN. Moser MJ, et al. J Cell Sci. 1997 Aug;110 ( Pt 15):1805-12. doi: 10.1242/jcs.110.15.1805. J Cell Sci. 1997. PMID: 9264467 - Vesicle-mediated protein transport pathways to the vacuole in Schizosaccharomyces pombe.
Takegawa K, Iwaki T, Fujita Y, Morita T, Hosomi A, Tanaka N. Takegawa K, et al. Cell Struct Funct. 2003 Oct;28(5):399-417. doi: 10.1247/csf.28.399. Cell Struct Funct. 2003. PMID: 14745133 Review. - Duplication of the Yeast Spindle Pole Body Once per Cell Cycle.
Rüthnick D, Schiebel E. Rüthnick D, et al. Mol Cell Biol. 2016 Apr 15;36(9):1324-31. doi: 10.1128/MCB.00048-16. Print 2016 May. Mol Cell Biol. 2016. PMID: 26951196 Free PMC article. Review.
Cited by
- Identification of interphase functions for the NIMA kinase involving microtubules and the ESCRT pathway.
Govindaraghavan M, McGuire Anglin SL, Shen KF, Shukla N, De Souza CP, Osmani SA. Govindaraghavan M, et al. PLoS Genet. 2014 Mar 27;10(3):e1004248. doi: 10.1371/journal.pgen.1004248. eCollection 2014 Mar. PLoS Genet. 2014. PMID: 24675878 Free PMC article. - STK25 suppresses Hippo signaling by regulating SAV1-STRIPAK antagonism.
Bae SJ, Ni L, Luo X. Bae SJ, et al. Elife. 2020 Apr 15;9:e54863. doi: 10.7554/eLife.54863. Elife. 2020. PMID: 32292165 Free PMC article. - High-Throughput Identification of Nuclear Envelope Protein Interactions in Schizosaccharomyces pombe Using an Arrayed Membrane Yeast-Two Hybrid Library.
Varberg JM, Gardner JM, McCroskey S, Saravanan S, Bradford WD, Jaspersen SL. Varberg JM, et al. G3 (Bethesda). 2020 Dec 3;10(12):4649-4663. doi: 10.1534/g3.120.401880. G3 (Bethesda). 2020. PMID: 33109728 Free PMC article. - The molecular basis for selective assembly of the UBAP1-containing endosome-specific ESCRT-I complex.
Wunderley L, Brownhill K, Stefani F, Tabernero L, Woodman P. Wunderley L, et al. J Cell Sci. 2014 Feb 1;127(Pt 3):663-72. doi: 10.1242/jcs.140673. Epub 2013 Nov 27. J Cell Sci. 2014. PMID: 24284069 Free PMC article. - STRIPAK complex defects result in pseudosexual reproduction in Cryptococcus neoformans.
Peterson PP, Croog S, Choi Y, Sun S, Heitman J. Peterson PP, et al. bioRxiv [Preprint]. 2025 Apr 18:2025.04.08.647827. doi: 10.1101/2025.04.08.647827. bioRxiv. 2025. PMID: 40297506 Free PMC article. Preprint.
References
- Aslett M, Wood V. Gene Ontology annotation status of the fission yeast genome: preliminary coverage approaches 100% Yeast. 2006;23:913–919. - PubMed
Publication types
MeSH terms
Substances
Grants and funding
- HHMI/Howard Hughes Medical Institute/United States
- P30 CA042014/CA/NCI NIH HHS/United States
- T32 CA093247/CA/NCI NIH HHS/United States
- 5T32 CA93247-9/CA/NCI NIH HHS/United States
LinkOut - more resources
Full Text Sources
Molecular Biology Databases

