Xenome--a tool for classifying reads from xenograft samples - PubMed (original) (raw)
Xenome--a tool for classifying reads from xenograft samples
Thomas Conway et al. Bioinformatics. 2012.
Abstract
Motivation: Shotgun sequence read data derived from xenograft material contains a mixture of reads arising from the host and reads arising from the graft. Classifying the read mixture to separate the two allows for more precise analysis to be performed.
Results: We present a technique, with an associated tool Xenome, which performs fast, accurate and specific classification of xenograft-derived sequence read data. We have evaluated it on RNA-Seq data from human, mouse and human-in-mouse xenograft datasets.
Availability: Xenome is available for non-commercial use from http://www.nicta.com.au/bioinformatics.
Figures
Fig. 1.
A Venn diagram showing the different classes that a given _k_-mer may belong to. The marginal host (and marginal graft) partitions are for those host (and graft) _k_-mers that are Hamming distance 1 from a _k_-mer in the graft (and host) reference
Fig. 2.
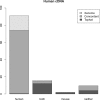
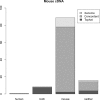
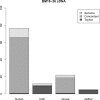
Summary of the results with Human cDNA. Each of the classes of reads is divided into those reads assigned to the class only by Xenome (Xenome), only by the Tophat analysis (Tophat) or by both Xenome and the Tophat analysis (Concordant)
Fig. 3.
Summary of the results with Murine cDNA
Fig. 4.
Summary of the results with BM18 xenograft cDNA
Fig. 5.
Validation of the in silico classification of xenograft RNA-Seq data with qRT-PCR. The horizontal axis shows log10_FPKM_ for the _Xenome_-derived gene expression for the 18 test genes. The vertical axis shows the _C_t value for each gene relative to the C_t of actin. There were two RNA-Seq samples processed (biological replicates), and four replicates of the qRT-PCR. For each gene, an ellipse is shown centered on the mean log10_FPKM in the _x_-axis, and on the mean relative _C_t in the _y_-axis. The horizontal and vertical radii show the variance in the samples
Fig. 6.
An in silico analysis showing the degree of ambiguity in HG19 refGene, according to the _k_-mer based analysis used by Xenome. In this analysis, k = 25
Fig. 7.
A plot showing the distribution of human genes with respect to the proportion of xenograft reads which are classed as both by the _Tophat_-based analysis and the Xenome analysis. The reads considered are only those mapped by Tophat since Xenome does not yield mappings, so cannot be used to assign reads to genes. Only genes for which at least 20 reads mapped were considered. The horizontal axis corresponds to the number of reads classified as both or ambiguous by Xenome as a proportion of all the reads that might possibly be human (i.e. both, ambiguous or human). The vertical axis corresponds to the number of reads classified as both by the _Tophat_-based analysis, once again, as a proportion of all the reads that might possibly be human
Similar articles
- OSA: a fast and accurate alignment tool for RNA-Seq.
Hu J, Ge H, Newman M, Liu K. Hu J, et al. Bioinformatics. 2012 Jul 15;28(14):1933-4. doi: 10.1093/bioinformatics/bts294. Epub 2012 May 15. Bioinformatics. 2012. PMID: 22592379 - Hierarchical analysis of RNA-seq reads improves the accuracy of allele-specific expression.
Raghupathy N, Choi K, Vincent MJ, Beane GL, Sheppard KS, Munger SC, Korstanje R, Pardo-Manual de Villena F, Churchill GA. Raghupathy N, et al. Bioinformatics. 2018 Jul 1;34(13):2177-2184. doi: 10.1093/bioinformatics/bty078. Bioinformatics. 2018. PMID: 29444201 Free PMC article. - RNA-Seq gene expression estimation with read mapping uncertainty.
Li B, Ruotti V, Stewart RM, Thomson JA, Dewey CN. Li B, et al. Bioinformatics. 2010 Feb 15;26(4):493-500. doi: 10.1093/bioinformatics/btp692. Epub 2009 Dec 18. Bioinformatics. 2010. PMID: 20022975 Free PMC article. - FBB: a fast Bayesian-bound tool to calibrate RNA-seq aligners.
Rodriguez-Lujan I, Hasty J, Huerta R. Rodriguez-Lujan I, et al. Bioinformatics. 2017 Jan 15;33(2):210-218. doi: 10.1093/bioinformatics/btw608. Epub 2016 Sep 23. Bioinformatics. 2017. PMID: 27663496 - A comparison of next-generation sequencing analysis methods for cancer xenograft samples.
Dai W, Liu J, Li Q, Liu W, Li YX, Li YY. Dai W, et al. J Genet Genomics. 2018 Jul 20;45(7):345-350. doi: 10.1016/j.jgg.2018.07.001. Epub 2018 Jul 25. J Genet Genomics. 2018. PMID: 30055875 Review.
Cited by
- SUMO2 Inhibition Reverses Aberrant Epigenetic Rewiring Driven by Synovial Sarcoma Fusion Oncoproteins and Impairs Sarcomagenesis.
Iyer R, Deshpande A, Pedgaonkar A, Bala PA, Kim T, Brien GL, Finlay D, Vuori K, Soragni A, Murad R, Deshpande AJ. Iyer R, et al. bioRxiv [Preprint]. 2024 Sep 25:2024.09.23.614593. doi: 10.1101/2024.09.23.614593. bioRxiv. 2024. PMID: 39386552 Free PMC article. Preprint. - DNA demethylation triggers cell free DNA release in colorectal cancer cells.
Pessei V, Macagno M, Mariella E, Congiusta N, Battaglieri V, Battuello P, Viviani M, Gionfriddo G, Lamba S, Lorenzato A, Oddo D, Idrees F, Cavaliere A, Bartolini A, Guarrera S, Linnebacher M, Monteonofrio L, Cardone L, Milella M, Bertotti A, Soddu S, Grassi E, Crisafulli G, Bardelli A, Barault L, Di Nicolantonio F. Pessei V, et al. Genome Med. 2024 Oct 9;16(1):118. doi: 10.1186/s13073-024-01386-5. Genome Med. 2024. PMID: 39385243 Free PMC article. - Patient-derived xenografts and single-cell sequencing identifies three subtypes of tumor-reactive lymphocytes in uveal melanoma metastases.
Karlsson JW, Sah VR, Olofsson Bagge R, Kuznetsova I, Iqba M, Alsen S, Stenqvist S, Saxena A, Ny L, Nilsson LM, Nilsson JA. Karlsson JW, et al. Elife. 2024 Sep 23;12:RP91705. doi: 10.7554/eLife.91705. Elife. 2024. PMID: 39312285 Free PMC article. - Proteostasis perturbation of N-Myc leveraging HSP70 mediated protein turnover improves treatment of neuroendocrine prostate cancer.
Xu P, Yang JC, Chen B, Ning S, Zhang X, Wang L, Nip C, Shen Y, Johnson OT, Grigorean G, Phinney B, Liu L, Wei Q, Corey E, Tepper CG, Chen HW, Evans CP, Dall'Era MA, Gao AC, Gestwicki JE, Liu C. Xu P, et al. Nat Commun. 2024 Aug 5;15(1):6626. doi: 10.1038/s41467-024-50459-x. Nat Commun. 2024. PMID: 39103353 Free PMC article. - Genomic profiling of a multi-lineage and multi-passage patient-derived xenograft biobank reflects heterogeneity of ovarian cancer.
Qin T, Hu Z, Zhang L, Lu F, Xiao R, Liu Y, Fan J, Guo E, Yang B, Fu Y, Zhuang X, Kang X, Wu Z, Fang Z, Cui Y, Hu X, Yin J, Yan M, Li F, Song K, Chen G, Sun C. Qin T, et al. Cell Rep Med. 2024 Jul 16;5(7):101631. doi: 10.1016/j.xcrm.2024.101631. Epub 2024 Jul 9. Cell Rep Med. 2024. PMID: 38986623 Free PMC article.
References
- Arbitman Y., et al. 2010 IEEE 51st Annual Symposium on Foundations of Computer Science. Los Alamos California: IEEE Computer Society; 2010. Backyard cuckoo hashing: Constant worst-case operations with a succinct representation; pp. 787–796.
- Conway T.C., Bromage A.J. Succinct data structures for assembling large genomes. Bioinformatics. 2011;27:479–486. - PubMed
Publication types
MeSH terms
Substances
LinkOut - more resources
Full Text Sources
Other Literature Sources


