Properties and fate of oligodendrocyte progenitor cells in the corpus callosum, motor cortex, and piriform cortex of the mouse - PubMed (original) (raw)
Properties and fate of oligodendrocyte progenitor cells in the corpus callosum, motor cortex, and piriform cortex of the mouse
Laura E Clarke et al. J Neurosci. 2012.
Abstract
Oligodendrocyte progenitor cells (OPCs) in the postnatal mouse corpus callosum (CC) and motor cortex (Ctx) reportedly generate only oligodendrocytes (OLs), whereas those in the piriform cortex may also generate neurons. OPCs have also been subdivided based on their expression of voltage-gated ion channels, ability to respond to neuronal activity, and proliferative state. To determine whether OPCs in the piriform cortex have inherently different physiological properties from those in the CC and Ctx, we studied acute brain slices from postnatal transgenic mice in which GFP expression identifies OL lineage cells. We whole-cell patch clamped GFP-expressing (GFP(+)) cells within the CC, Ctx, and anterior piriform cortex (aPC) and used prelabeling with 5-ethynyl-2'-deoxyuridine (EdU) to assess cell proliferation. After recording, slices were immunolabeled and OPCs were defined by strong expression of NG2. NG2(+) OPCs in the white and gray matter proliferated and coexpressed PDGFRα and voltage-gated Na(+) channels (I(Na)). Approximately 70% of OPCs were capable of generating regenerative depolarizations. In addition to OLIG2(+) NG2(+) I(Na)(+) OPCs and OLIG2(+) NG2(neg) I(Na)(neg) OLs, we identified cells with low levels of NG2 limited to the soma or the base of some processes. These cells had a significantly reduced I(Na) and a reduced ability to incorporate EdU when compared with OPCs and probably correspond to early differentiating OLs. By combining EdU labeling and lineage tracing using Pdgfrα-CreER(T2) : R26R-YFP transgenic mice, we double labeled OPCs and traced their fate in the postnatal brain. These OPCs generated OLs but did not generate neurons in the aPC or elsewhere at any time that we examined.
Figures
Figure 1.
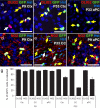
Pdgfrα–GFP mice label oligodendroglial cells in the postnatal brain. a–f, Cryosections from P9 to P33 Pdgfrα–GFP mice were immunolabeled to detect GFP (green) with either OLIG2 (red; a–c) or NG2 (red; d–f). Double-labeled cells are indicated by a yellow arrow and single-labeled cells by a white arrow. Sections were also stained with Hoechst 33258 (Hst; blue) to detect cell nuclei. g, The proportions of GFP+ cells that coexpressed each marker were quantified for the Ctx, CC, and aPC. The proportion of GFP+ cells that coexpressed NG2 fell significantly from P9 to P33 (ANOVA; p < 0.01). Scale bars, 20 μm.
Figure 2.
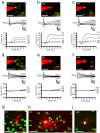
Two types of GFP+ OL lineage cells in the postnatal mouse brain. a–f, Cells expressing GFP driven by the _Pdgfr_α promoter (green) were whole-cell patch clamped and filled with Alexa Fluor-568 dye (red) (top image in columns a–f). Current responses (second panel of a–f) were recorded for GFP+ cells with and without INa (a–c and d–f, respectively), to voltage steps in 20 mV increments from −70 mV. Voltage-gated currents were isolated by subtracting the linearly scaled capacity transient and ohmic leak current evoked by a hyperpolarizing pulse (bottom sets of traces). Representative data, at either P9 (a–d) or P33 (e, f) from GFP+ cells in the CC (a, d), Ctx (b, e), and aPC (c, f) are shown. g–i, GFP was mainly expressed by cells with typical OPC morphology in white and gray matter [e.g., dye-filled GFP+ cells in the CC (g) and aPC (i)], but GFP could also be occasionally detected in cells that were more advanced in their differentiation with more OL-like morphology, including myelinating internodes (e.g., dye-filled GFP+ cell in the CC; h). White arrows indicate myelin internodes. Scale bars: a–f, 50 μm; g–i, 30 μm.
Figure 3.
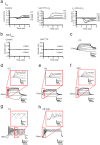
INa+ GFP+ cells generate action potential-like events in response to current injection. a, Left, Capacity transient and ohmic leak-subtracted responses of a GFP+ cell with INa to voltage steps in 20 mV increments from −70 mV. Middle, TTX at 1 μ
m
blocked the INa. Right, Subtracting the voltage-gated IK isolated in TTX from the total voltage-gated current gave the voltage-gated Na+ current. b, Left, Capacity transient and ohmic leak-subtracted responses of a GFP+ cell without INa to voltage steps in increments of 20 mV (to −110 to +10 mV) from −70 mV. Right, TTX did not change the response of the cell to voltage steps. Traces representative of three GFP+ cells without INa are shown. c–f, Responses of white and gray matter GFP+ cells to depolarizing current injection (−20, 0, 20, 60, 100, 160, 220, and 260 pA of current was injected). c, Current-clamp recording of a GFP+ cell without INa, at P9, in the CC; similar responses were seen in all other brain areas examined. d–f, Current-clamp recordings for GFP+ cells with INa, at P9, in the CC (d), Ctx (e), and aPC (f). g, h, Current-clamp recordings from GFP+ INa cells, which produced repetitive action potential-like waves in the CC at P33 (40, 140 pA of current was injected) (g) and cerebellar white matter (CB WM) at P9 (40, 80, 120 pA of current was injected) (h). Red boxes indicate the region of the trace that has been enlarged.
Figure 4.
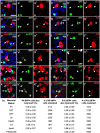
A small proportion of calretinin+ interneurons express GFP in the medial motor Ctx of Pdgfrα–GFP transgenic mice. a–l, Cryosections from P9 and P33 Pdgfrα–GFP transgenic mice were costained to detect GFP (green) and a variety of neuronal markers (red): parvalbumin (PV; a), SST (b), NPY (c), calbindin (cb; d), reelin (e), calretinin (crt; f–h), NeuN (i–k), and PSA-NCAM (l). m, The number of single-labeled GFP+ cells (white arrowheads), single-labeled neuronal cells (white arrows), and colabeled cells (yellow arrows) was counted. The table gives the proportion of GFP+ cells that coexpressed any of the neuronal markers. This was quantified in the Ctx for three mice and is expressed as the average percentage ± SEM. The total number of GFP+ cells examined is also given. The only neuronal markers expressed by subsets of cortical GFP+ cells were calretinin and NeuN. Scale bars: a, c–e, h, j–l, 15 μm; b, f, g, i, 10 μm.
Figure 5.
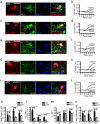
All brain NG2+ OPCs express INa and proliferate. a–j, Images of dye fills of whole-cell patch-clamped GFP+ cells in CC, Ctx, and aPC (red) and labeling for NG2 (green) and EdU [or Hoechst 33258 (Hst) in g, **i**] (blue) (left), together with current responses to depolarizing voltage steps in 20 mV increments from −70 mV (right). Cells fell into one of three main groups: a–f, NG2+ INa+ mitotic (EdU+) OPCs; g, h, NG2low INalow early differentiating OLs; and i, j, electrically passive OLs (NG2neg, INaneg). k–n, The average electrophysiological data for NG2+ OPCs (mean ± SEM) at P9 (CC, n = 20; Ctx, n = 15; aPC, n = 14 cells) and P33 (CC, n = 22; Ctx, n = 17; aPC, n = 41 cells) are shown, including the following: k, peak inward current on depolarization from −70 to +10 mV; l, membrane resistance at −70 mV; m, membrane capacitance; and n, peak outward current (on depolarization from −70 to +10 mV). Scale bars, 20 μm.
Figure 6.
All NG2+ OPCs in the aPC proliferate and incorporate EdU. a, Coronal brain sections containing the aPC immunolabeled to detect PDGFRα (red) and NG2 (green) to identify OPCs and then developed to visualize EdU incorporation (blue). b, The proportion of OPCs (PDGFRα+ NG2+) that had incorporated EdU as a function of EdU administration time (mean ± SEM, n = 3 mice for each time point). Scale bar, 35 μm.
Figure 7.
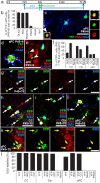
OPCs generate new OLs but not neurons in the postnatal mouse brain. a, Pdgfrα–CreERT2 : R26R–YFP transgenic mice received EdU from P25, tamoxifen from P45 to P48, and were perfusion fixed at P115 (P45 + 70). b, Proportions of YFP+ cells in aPC of P45 + 6 Pdgfrα–CreERT2 : R26R–YFP mouse brains that were OPCs (NG2+), OLs (CC1+), neuroblasts [PSA-NCAM+ (PSAN)], neurons (NeuN+), or microglia (Iba1+) (mean ± SEM, n = 3 mice). c, Immunolabeling of the aPC of P45 + 6 Pdgfrα–CreERT2 : R26R–YFP transgenic mice for NG2 (blue), GFP (green), and PSA-NCAM (red). d, A single-scan (1 μm) confocal image through a cell in the aPC of P45 + 6 Pdgfrα–CreERT2 : R26R–YFP transgenic mice that was immunolabeled for PSA-NCAM (blue), YFP (green), and DCX (red). e, Immunolabeling of the aPC of P45 + 6 Pdgfrα–CreERT2 : R26R–YFP transgenic mice for OLIG2 (blue), YFP (green), and NeuN (red). White arrowheads indicate unidentified YFP+ cells in the aPC. f, Proportions of YFP+ cells in the CC, Ctx, and aPC of P45 + 70 Pdgfrα–CreERT2 : R26R–YFP mice that were OPCs (NG2+), OLs (CC1+), or neurons (NeuN+) (mean ± SEM, n = 3 mice) and proportion in aPC that were PSA-NCAM+. g, Immunolabeling of the aPC for NG2 (red), GFP (green), and detection of EdU (blue). h–j, Immunolabeling of the CC (h), Ctx (i), and aPC (j) for CC1 antigen (red), GFP (green), and detection of EdU (blue). k, Immunolabeling of the aPC for NeuN (red), GFP (green), and detection of EdU (blue). l, Percentage of YFP+ OPCs (YFP+ NG2+), YFP+ OLs (YFP+ CC1+), and YFP+ neurons (YFP+ NeuN+) that incorporated EdU (mean ± SEM, n = 3 mice). White arrows indicate triple-labeled cells. Yellow arrows indicate double-positive but EdU-negative cells. Scale bars: c, e–k, 30 μm; d, 10 μm.
Figure 8.
GFP+ neurons accumulate in the aPC of postnatal Pdgfrα–CreERT2 : Tau–mGFP transgenic mice. a–c, Pdgfrα–CreERT2 transgenic mice were crossed with a different reporter mouse that, after recombination, expresses mGFP under the control of the Tau promoter (Tau–mGFP reporter mice; Hippenmeyer et al., 2005). The double-heterozygous Pdgfrα–CreERT2 : Tau–mGFP transgenic mice received tamoxifen from P45 to P48 to induce recombination in PDGFRα+ cells and were analyzed at P45 + 14, 27, 70, and 150 d, by immunolabeling coronal brain sections to detect mGFP (green) and NeuN (red). Cell nuclei were stained with Hoechst 33258 (Hst; blue). a, A maximum intensity projection of a confocal image stack through a 30 μm brain section, demonstrating the location of mGFP+ NeuN+ neurons (white arrows) in layer II of the aPC. b, A single-scan (1 μm) confocal image through an mGFP+ NeuN+ neuron. c, Numbers of mGFP+ NeuN+ cells in the aPC of each 30 μm coronal brain section. We observed a significant accumulation of mGFP+ neurons with time. However, it was smaller in magnitude than our previous report examining Pdgfrα–CreERT2 : R26R–YFP transgenic mice (Rivers et al., 2008), which probably reflects a difference in the recombination efficiencies of the two reporter lines.
Similar articles
- The voltage-gated calcium channel CaV1.2 promotes adult oligodendrocyte progenitor cell survival in the mouse corpus callosum but not motor cortex.
Pitman KA, Ricci R, Gasperini R, Beasley S, Pavez M, Charlesworth J, Foa L, Young KM. Pitman KA, et al. Glia. 2020 Feb;68(2):376-392. doi: 10.1002/glia.23723. Epub 2019 Oct 12. Glia. 2020. PMID: 31605513 Free PMC article. - A developmental study on the expression of PDGFalphaR immunoreactive cells in the brain of postnatal rats.
He Y, Cai W, Wang L, Chen P. He Y, et al. Neurosci Res. 2009 Nov;65(3):272-9. doi: 10.1016/j.neures.2009.07.011. Epub 2009 Aug 7. Neurosci Res. 2009. PMID: 19665498 - Unbiased stereological analysis of the fate of oligodendrocyte progenitor cells in the adult mouse brain and effect of reference memory training.
Boulanger JJ, Messier C. Boulanger JJ, et al. Behav Brain Res. 2017 Jun 30;329:127-139. doi: 10.1016/j.bbr.2017.04.027. Epub 2017 Apr 23. Behav Brain Res. 2017. PMID: 28442356 - Voltage-operated Ca(2+) and Na(+) channels in the oligodendrocyte lineage.
Paez PM, Fulton D, Colwell CS, Campagnoni AT. Paez PM, et al. J Neurosci Res. 2009 Nov 15;87(15):3259-66. doi: 10.1002/jnr.21938. J Neurosci Res. 2009. PMID: 19021296 Review. - Identity, distribution, and development of polydendrocytes: NG2-expressing glial cells.
Nishiyama A, Watanabe M, Yang Z, Bu J. Nishiyama A, et al. J Neurocytol. 2002 Jul-Aug;31(6-7):437-55. doi: 10.1023/a:1025783412651. J Neurocytol. 2002. PMID: 14501215 Review.
Cited by
- NG2-glia and their functions in the central nervous system.
Dimou L, Gallo V. Dimou L, et al. Glia. 2015 Aug;63(8):1429-51. doi: 10.1002/glia.22859. Epub 2015 May 24. Glia. 2015. PMID: 26010717 Free PMC article. Review. - Progenies of NG2 glia: what do we learn from transgenic mouse models ?
Guo Q, Scheller A, Huang W. Guo Q, et al. Neural Regen Res. 2021 Jan;16(1):43-48. doi: 10.4103/1673-5374.286950. Neural Regen Res. 2021. PMID: 32788446 Free PMC article. - How Do Cells of the Oligodendrocyte Lineage Affect Neuronal Circuits to Influence Motor Function, Memory and Mood?
Pepper RE, Pitman KA, Cullen CL, Young KM. Pepper RE, et al. Front Cell Neurosci. 2018 Nov 16;12:399. doi: 10.3389/fncel.2018.00399. eCollection 2018. Front Cell Neurosci. 2018. PMID: 30524235 Free PMC article. Review. - Maturation and electrophysiological properties of human pluripotent stem cell-derived oligodendrocytes.
Livesey MR, Magnani D, Cleary EM, Vasistha NA, James OT, Selvaraj BT, Burr K, Story D, Shaw CE, Kind PC, Hardingham GE, Wyllie DJ, Chandran S. Livesey MR, et al. Stem Cells. 2016 Apr;34(4):1040-53. doi: 10.1002/stem.2273. Epub 2016 Jan 13. Stem Cells. 2016. PMID: 26763608 Free PMC article. - Neural Tissue Homeostasis and Repair Is Regulated via CS and DS Proteoglycan Motifs.
Hayes AJ, Melrose J. Hayes AJ, et al. Front Cell Dev Biol. 2021 Aug 2;9:696640. doi: 10.3389/fcell.2021.696640. eCollection 2021. Front Cell Dev Biol. 2021. PMID: 34409033 Free PMC article. Review.
References
- Arisi GM, Foresti ML, Mukherjee S, Shapiro LA. The role of olfactory stimulus in adult mammalian neurogenesis. Behav Brain Res. 2012;227:356–362. - PubMed
- Bakiri Y, Attwell D, Káradóttir R. Electrical signalling properties of oligodendrocyte precursor cells. Neuron Glia Biol. 2009;5:3–11. - PubMed
- Barres BA, Raff MC. Proliferation of oligodendrocyte precursor cells depends on electrical activity in axons. Nature. 1993;361:258–260. - PubMed
- Bergles DE, Roberts JD, Somogyi P, Jahr CE. Glutamatergic synapses on oligodendrocyte precursor cells in the hippocampus. Nature. 2000;405:187–191. - PubMed
Publication types
MeSH terms
Substances
Grants and funding
- 1030939/MRC_/Medical Research Council/United Kingdom
- 080513/Wellcome Trust/United Kingdom
- G0800575/MRC_/Medical Research Council/United Kingdom
- G0800575(86419)/MRC_/Medical Research Council/United Kingdom
- 017948/Wellcome Trust/United Kingdom
- 075232/Wellcome Trust/United Kingdom
- Wellcome Trust/United Kingdom
LinkOut - more resources
Full Text Sources
Medical
Molecular Biology Databases
