Contrasting pathology of the stress granule proteins TIA-1 and G3BP in tauopathies - PubMed (original) (raw)
Contrasting pathology of the stress granule proteins TIA-1 and G3BP in tauopathies
Tara Vanderweyde et al. J Neurosci. 2012.
Abstract
Stress induces aggregation of RNA-binding proteins to form inclusions, termed stress granules (SGs). Recent evidence suggests that SG proteins also colocalize with neuropathological structures, but whether this occurs in Alzheimer's disease is unknown. We examined the relationship between SG proteins and neuropathology in brain tissue from P301L Tau transgenic mice, as well as in cases of Alzheimer's disease and FTDP-17. The pattern of SG pathology differs dramatically based on the RNA-binding protein examined. SGs positive for T-cell intracellular antigen-1 (TIA-1) or tristetraprolin (TTP) initially do not colocalize with tau pathology, but then merge with tau inclusions as disease severity increases. In contrast, G3BP (ras GAP-binding protein) identifies a novel type of molecular pathology that shows increasing accumulation in neurons with increasing disease severity, but often is not associated with classic markers of tau pathology. TIA-1 and TTP both bind phospho-tau, and TIA-1 overexpression induces formation of inclusions containing phospho-tau. These data suggest that SG formation might stimulate tau pathophysiology. Thus, study of RNA-binding proteins and SG biology highlights novel pathways interacting with the pathophysiology of AD, providing potentially new avenues for identifying diseased neurons and potentially novel mechanisms regulating tau biology.
Figures
Figure 1.
TIA-1-positive SGs increase with disease state. A, Immunohistochemistry for SGs (TIA-1, red) show increased abundance with disease state, and that colocalization with phospho-tau (PHF-1, S396,404, green) increases with disease state. Nuclei are identified with DAPI (blue). Sections were treated with Sudan Black to quench endogenous fluorescence and highlight the fluorescence associated with pathology, which is brighter. Arrows point to colocalization. The bottom set of panels (High Mag) show higher magnification images of the images directly above (severe). Scale bar, 10 μm. B, TIA-1 immunofluorescence in amygdala from a non-transgenic mouse (SW Ctrl) or young JNPL3 mouse (Nml; age, 2 months). The endogenous nuclear TIA-1 fluorescence evident in sections not treated with Sudan Black is not evident in sections treated with Sudan Black. C, Colocalization of eIF3-positive (red) granules with PHF-1-positive (green) tau in brain tissue from JNPL3 mice. Arrows point to colocalization. The bottom set of panels (High Mag) show higher magnification images of the images directly above (severe). Nuclei are identified with DAPI (blue). D, Demonstration of antibody specificity by immunoabsorption. Sections of amygdala from a JNPL3 mouse with severe disease were probed with antibodies to PHF-1 and eTIA-1. Pre-adsorbing the primary antibody with the epitope peptides abolished all reactivity for the corresponding antibody. E, Density of SGs increase greatly during the moderate and severe disease state. Density was determined using Fiji software to quantify SG puncta per 63× frame with a threshold set to >1 μm2 (controlled for cell number). F, The extent of colocalization between SGs with phospho-tau increase with inclusion size. Colocalization is largely absent in Tg Normal and SW Control mice and is not reported here. G, Colocalization of Tau with TIA-1 increases greatly in JNPL3 mice with moderate and severe disease. Inclusions that react with PHF-1-positive Tau and TIA-1 show high levels of colocalization within each inclusion. H, Within each lesion, the TIA-1 and PHF-1 signal were highly localized. Scale bar, 10 μm.
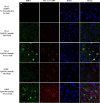
Figure 2.
SG pathology in P301L tau transgenic mice. The patterns of evolution of reactivity for the RNA-binding proteins were very similar between the JNPL3 and rTg4510 mouse models, except that the latter develops more severe pathology at end-stage disease. Few SGs are evident in 2-month-old mice with no evident disease and no evident phospho-tau (PHF-1) reactivity. In moderate disease (5 months), TIA-1 (red) reactivity is present but frequently does not colocalize with tau pathology (PHF-1, green). In severe disease (8 months), TIA-1 reactivity strongly colocalizes with tau pathology. In contrast, G3BP (red) reactivity frequently does not colocalize with tau pathology. Nuclei are identified with DAPI (blue). Sections were treated with Sudan Black to quench endogenous fluorescence. Scale bar, 10 μ
m
.
Figure 3.
Correlation between TIA-1-positive SG expression and cell type. A, Colabeling TIA-1 (red) to identify SGs and NeuN (green) to identify neurons indicates that SG formation in neurons increases with disease state. Nuclei are identified with DAPI (blue). Sections were treated with Sudan Black to quench endogenous fluorescence. B, Colabeling identifies SGs (TIA-1, red) and astrocytes (GFAP, green) and shows modestly the presence of cytoplasmic SGs in astrocytes at each stage of the disease process. C, Colabeling SGs (TIA-1, red) and microglia (Iba-1, green) indicates that SGs are present in microglia mainly at the mild stage of disease. White arrows in the merged panels point to sites of colocalization. Scale bar, 10 μm.
Figure 4.
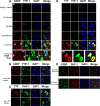
G3BP occurs in cells lacking PHF-1 reactivity. A, The cytoplasmic reactivity of G3BP (red) occurs early in the disease and increases with disease state but does not colocalize with phospho-tau protein (PHF-1, green), even at the severe stage of disease. Nuclei are identified with DAPI (blue). Sections were treated with Sudan Black to quench endogenous fluorescence. The bottom set of panels (High Mag) show higher magnification images of the images directly above (severe). Scale bar, 10 μm. B, C, Demonstration of antibody specificity by immunoabsorption. Sections of amygdala from a JNPL3 mouse with severe disease were probed with antibodies to PHF-1 and either G3BP (B) or TTP (C). Pre-adsorbing the primary antibody with the epitope peptides abolished all reactivity for the corresponding antibody. D, The cytoplasmic reactivity of TTP (red) increases with disease state and does not colocalize with phospho-tau protein (green), until the stage of severe disease. The bottom set of panels (High Mag) show higher magnification images of the images directly above (severe). E, The pattern of evolution of reactivity for G3BP was very similar between the JNPL3 and rTg4510 mouse models, except that the latter develops more severe pathology at end-stage disease. Few SGs were evident in 5-month-old mice with no evident disease and no evident phospho-tau (PHF-1) reactivity. In severe disease (8 months), G3BP (red) reactivity frequently does not colocalize with tau pathology. Nuclei are identified with DAPI (blue). Scale bar, 10 μm.
Figure 5.
TDP-43 and FUS form cytoplasmic inclusions in transgenic mice with moderate to severe disease. A, Immunocytochemical reactivity of TDP-43 (green), TIA-1 (red), and nuclei (DAPI, blue) in brains of mice of varying disease states. B, Immunocytochemical reactivity of TDP-43 (green), neurons (NeuN, red), and nuclei (DAPI, blue) in brains of mice of moderate disease state. Sections were treated with Sudan Black to quench endogenous fluorescence. C, Immunocytochemical reactivity of FUS (red), PHF-1 (green), and nuclei (DAPI, blue) in brains of mice of varying disease states. D, Immunocytochemical reactivity of FUS (green), TIA-1 (red), and nuclei (DAPI, blue) in brains of mice of moderate disease state. Scale bar, 10 μm.
Figure 6.
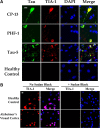
Colocalization of TIA-1 with tau pathology in the Alzheimer brain. A, Frontal cortex from a subject with AD was probed with antibodies to tau (phospho-tau, CP-13, PHF-1; total tau, Tau-5, green) and TIA-1 (red). Nuclei are identified with DAPI (blue). Sections were treated with Sudan Black to quench endogenous fluorescence. Large inclusions containing TIA-1 colocalize with each of the markers of tau protein that were tested. Figures from AD case 5 shown. B, TIA-1 immunofluorescence in Alzheimer cortex (frontal) and Control cortex (occipital) treated with ± Sudan Black. The endogenous nuclear TIA-1 fluorescence is not evident in sections treated with Sudan Black. Scale bar, 10 μm.
Figure 7.
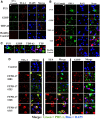
Expression of FUS, G3BP, TTP, and TDP-43 in the Alzheimer brain. A, Frontal cortex from a subject with AD was probed with antibodies to FUS, G3BP, and TDP-43 (green) and double labeled with anti-TIA-1 antibody (red). Nuclei are identified with DAPI (blue). Sections were treated with Sudan Black to quench endogenous fluorescence. FUS showed some colocalization with TIA-1, while neither G3BP nor TDP-43 showed significant colocalization with TIA-1. Control represents a health control cortex with rabbit serum substituted for primary antibody; similar results were observed using AD cortex. B, Frontal cortex from a subject with AD probed with antibodies to FUS, G3BP, TDP-43, and TTP (green) and double labeled with PHF-1 antibody (red). Nuclei are identified with DAPI (blue). FUS, G3BP, and TDP-43 did not show significant colocalization with PHF-1, while TTP did partially colocalize with PHF-1. Control represents FTDP-17 cortex with rabbit serum substituted for primary antibody. Figures from AD cases 5 and 10 shown. C, Merged images from B shown at higher magnification. Red, RNA-binding protein; green, PHF-1; blue, DAPI. D, Frontal cortex from different subjects with FTDP-17 (numerical identifications shown) probed with antibodies to TTP, TIA-1, and G3BP (green), and double labeled with PHF-1 antibody (red). Nuclei are identified with DAPI (blue). Only the green and merged images are shown. Scale bar, 10 μm.
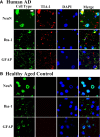
Figure 8.
TIA-1-positive SGs are evident in neurons, microglia, and astrocytes in the Alzheimer brain. A, Frontal cortex tissue from a subject with AD was incubated with antibodies (green) to NeuN, Iba-1, and GFAP to identify neurons, microglia, and astrocytes, respectively. TIA-1-positive (red) reactivity was present in all three cell types. Nuclei are identified with DAPI (blue). Sections were treated with Sudan Black to quench endogenous fluorescence. B, A similar study performed in frontal cortex from a healthy, aged control. Figures from AD cases 5 and 10 and neurologically normal control case 1 are shown. Scale bar, 10 μm.
Figure 9.
Disease severity modulates levels and biochemical behavior of RNA-binding proteins. A, Immunoblots showing levels of TIA-1, TTP, G3BP, FUS, TDP-43, Tau5, and PHF-1 in whole brain lysates from rTg4510 mice at differing levels of disease severity. B, Quantification of immunoblots of whole brain lysates from rTg4510 mice (N = 3). C, Immunoblots showing levels of TIA-1, TTP, G3BP, FUS, and TDP-43 in heat stable fractions (soluble tau) from rTg4510 mice at differing levels of disease severity. D, Quantification of immunoblots of heat stable fractions (soluble tau) from rTg4510 mice (N = 3). E, Immunoblots showing levels of TIA-1, TTP, G3BP, FUS, TDP-43, and PHF-1 tau, in Triton-X insoluble lysates from rTg4510 mice at differing levels of disease severity. F, Immunoprecipitation of total tau with the Tau-5 antibody, followed by immunoblotting with Tau-5, TIA-1, TTP, or G3BP. Note: No immunoreactivity was observed at the molecular weight of holo-G3BP (47 KDa), however, a band reactive with the anti-G3BP antibody was apparent at 35 KDa. This band is labeled as 35 KDa G3 band. G, Quantification of immunoblots from the Tau-5 immunoprecipitations. H, Immunoprecipitation of phosphorylated tau with the PHF-1 antibody, followed by immunoblotting with Tau-5, TIA-1, TTP, or G3BP. I, Quantification of immunoblots from the PHF-1 immunoprecipitations.
Figure 10.
Coexpressing TIA-1 and tau induces inclusion formation in the context of exogenous stress. A, SH-SY5Y cells were transfected with TIA-1 ± tau (WT or P301L) and grown under basal conditions (left panels labeled “No Arsenite”) or with arsenite (“+ Arsenite”, 15 μ
m
, 24 h). Arrows point to examples of inclusions that formed. The white box delineates areas that are shown at higher magnification in the right-hand column. Scale bar, 3 μm. B, Quantification of the number of TIA-1-positive inclusions with a size >1 μm. C, Quantification of the number of PHF-1 tau-positive inclusions with a size >1 μm.
Similar articles
- Pathological stress granules in Alzheimer's disease.
Ash PE, Vanderweyde TE, Youmans KL, Apicco DJ, Wolozin B. Ash PE, et al. Brain Res. 2014 Oct 10;1584:52-8. doi: 10.1016/j.brainres.2014.05.052. Epub 2014 Aug 7. Brain Res. 2014. PMID: 25108040 Free PMC article. - Newcastle disease virus induces stable formation of bona fide stress granules to facilitate viral replication through manipulating host protein translation.
Sun Y, Dong L, Yu S, Wang X, Zheng H, Zhang P, Meng C, Zhan Y, Tan L, Song C, Qiu X, Wang G, Liao Y, Ding C. Sun Y, et al. FASEB J. 2017 Apr;31(4):1337-1353. doi: 10.1096/fj.201600980R. Epub 2016 Dec 23. FASEB J. 2017. PMID: 28011649 - Herpes simplex virus 2 infection impacts stress granule accumulation.
Finnen RL, Pangka KR, Banfield BW. Finnen RL, et al. J Virol. 2012 Aug;86(15):8119-30. doi: 10.1128/JVI.00313-12. Epub 2012 May 23. J Virol. 2012. PMID: 22623775 Free PMC article. - Tau Protein Interaction Partners and Their Roles in Alzheimer's Disease and Other Tauopathies.
Sinsky J, Pichlerova K, Hanes J. Sinsky J, et al. Int J Mol Sci. 2021 Aug 26;22(17):9207. doi: 10.3390/ijms22179207. Int J Mol Sci. 2021. PMID: 34502116 Free PMC article. Review. - Cytoplasmic mRNP granules at a glance.
Erickson SL, Lykke-Andersen J. Erickson SL, et al. J Cell Sci. 2011 Feb 1;124(Pt 3):293-7. doi: 10.1242/jcs.072140. J Cell Sci. 2011. PMID: 21242308 Free PMC article. Review. No abstract available.
Cited by
- Stress granules as crucibles of ALS pathogenesis.
Li YR, King OD, Shorter J, Gitler AD. Li YR, et al. J Cell Biol. 2013 Apr 29;201(3):361-72. doi: 10.1083/jcb.201302044. J Cell Biol. 2013. PMID: 23629963 Free PMC article. Review. - Internalized Tau sensitizes cells to stress by promoting formation and stability of stress granules.
Brunello CA, Yan X, Huttunen HJ. Brunello CA, et al. Sci Rep. 2016 Jul 27;6:30498. doi: 10.1038/srep30498. Sci Rep. 2016. PMID: 27460788 Free PMC article. - SFPQ and Tau: critical factors contributing to rapid progression of Alzheimer's disease.
Younas N, Zafar S, Shafiq M, Noor A, Siegert A, Arora AS, Galkin A, Zafar A, Schmitz M, Stadelmann C, Andreoletti O, Ferrer I, Zerr I. Younas N, et al. Acta Neuropathol. 2020 Sep;140(3):317-339. doi: 10.1007/s00401-020-02178-y. Epub 2020 Jun 23. Acta Neuropathol. 2020. PMID: 32577828 Free PMC article. - TIA1 regulates the generation and response to toxic tau oligomers.
Jiang L, Ash PEA, Maziuk BF, Ballance HI, Boudeau S, Abdullatif AA, Orlando M, Petrucelli L, Ikezu T, Wolozin B. Jiang L, et al. Acta Neuropathol. 2019 Feb;137(2):259-277. doi: 10.1007/s00401-018-1937-5. Epub 2018 Nov 21. Acta Neuropathol. 2019. PMID: 30465259 Free PMC article. - Differences between acute and chronic stress granules, and how these differences may impact function in human disease.
Reineke LC, Neilson JR. Reineke LC, et al. Biochem Pharmacol. 2019 Apr;162:123-131. doi: 10.1016/j.bcp.2018.10.009. Epub 2018 Oct 14. Biochem Pharmacol. 2019. PMID: 30326201 Free PMC article. Review.
References
- Anderson P, Kedersha N. Stress granules: the Tao of RNA triage. Trends Biochem Sci. 2008;33:141–150. - PubMed
- Atlas R, Behar L, Elliott E, Ginzburg I. The insulin-like growth factor mRNA binding-protein IMP-1 and the Ras-regulatory protein G3BP associate with tau mRNA and HuD protein in differentiated P19 neuronal cells. J Neurochem. 2004;89:613–626. - PubMed
- Blair IP, Williams KL, Warraich ST, Durnall JC, Thoeng AD, Manavis J, Blumbergs PC, Vucic S, Kiernan MC, Nicholson GA. FUS mutations in amyotrophic lateral sclerosis: clinical, pathological, neurophysiological and genetic analysis. J Neurol Neurosurg Psychiatry. 2010;81:639–645. - PubMed
- Chen YZ, Bennett CL, Huynh HM, Blair IP, Puls I, Irobi J, Dierick I, Abel A, Kennerson ML, Rabin BA, Nicholson GA, Auer-Grumbach M, Wagner K, De Jonghe P, Griffin JW, Fischbeck KH, Timmerman V, Cornblath DR, Chance PF. DNA/RNA helicase gene mutations in a form of juvenile amyotrophic lateral sclerosis (ALS4) Am J Hum Genet. 2004;74:1128–1135. - PMC - PubMed
Publication types
MeSH terms
Substances
Grants and funding
- ES15567/ES/NIEHS NIH HHS/United States
- R21 NS066108/NS/NINDS NIH HHS/United States
- R21 NS073679/NS/NINDS NIH HHS/United States
- F31 AG042213/AG/NIA NIH HHS/United States
- NS073679/NS/NINDS NIH HHS/United States
- R01 NS060872/NS/NINDS NIH HHS/United States
- AG042213/AG/NIA NIH HHS/United States
- NS066108/NS/NINDS NIH HHS/United States
- R01 ES020395/ES/NIEHS NIH HHS/United States
- T32 GM008541/GM/NIGMS NIH HHS/United States
- R01 ES015567/ES/NIEHS NIH HHS/United States
- NS060872/NS/NINDS NIH HHS/United States
LinkOut - more resources
Full Text Sources
Other Literature Sources
Molecular Biology Databases
Miscellaneous

