Expression of TRPC6 in renal cortex and hippocampus of mouse during postnatal development - PubMed (original) (raw)
Expression of TRPC6 in renal cortex and hippocampus of mouse during postnatal development
Pengjuan Xu et al. PLoS One. 2012.
Abstract
TRPC6, a member of the TRPC family, attracts much attention from the public because of its relationship with the disease. In both the brain and kidney, TRPC6 serves a variety of functions. The aim of the present study was to observe the expression and effects of TRPC6 in renal cortex and hippocampus during early postnatal development of the mouse. In the present study, immunohistochemistry and Western blotting were used to detect the expression of TRPC6 in the mouse kidney and hippocampus of postnatal day 1, 3, 5, 7, 14, 21, 28 and 49 (P1, P3, P5, P7, P14, P21, P28 and P49). Results showed that the expression of TRPC6 was increased in the mouse hippocampus, and there was a significant increase between P7 and P14 during the postnatal development. Meanwhile, the expression of TRPC6 was also detected in glomerulus and tubules, and a decreased expression was found during postnatal maturation of mouse renal cortex. From these in vivo experiments, we concluded that the expression of TRPC6 was active in the developing mouse kidney cortex, and followed a loss of expression with the development of kidney. Meanwhile, an increased expression was found in the hippocampus with the development. Together, these data suggested that the developmental changes in TRPC6 expression might be required for proper postnatal kidney cortex development, and played a critical role in the hippocampus during development, which formed the basis for understanding the nephrogenesis and neurogenesis in mice and provided a practically useful knowledge to the clinical and related research.
Conflict of interest statement
Competing Interests: The authors have declared that no competing interests exist.
Figures
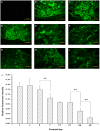
Figure 1. Localization of TRPC6 in mouse renal cortex during postnatal development.
Immunohistochemical staining of TRPC6 showed the expression of TRPC6 in the mouse renal cortex at P1 (B), P3 (C), P5 (D), P7 (E), P14 (F), P21 (G), P28 (H), and P49 (I). The negative control image was from the renal cortex, in which the primary antibody was a species-appropriate IgG (A). The corresponding linear diagram of relative fluorescent intensity in glomeruli was shown in (J). The sections from P1 to P5 showed that TRPC6 mostly expressed in comma-shaped body, S-shaped body and renal corpuscles of stage III (B-D). After P7 the expression was found in renal corpuscles and it was weakly positive (E-F). During the development, tubules were all observed. Scale bar, 100 µm. Data were presented as means±S.D. n = 6/group. *P<0.05, **P<0.01 vs. adjacent age group.
Figure 2. Immunoblot analysis of TRPC6 in mouse renal cortex during the development.
The position of 106 kDa molecular size was the expression pattern of TRPC6 in renal cortex at the indicated ages (A). Quantitative determination of immunoblot showed significant changes in TRPC6 expression in mouse renal cortex during the development (B). The expression of TRPC6 was normalized to β-actin expression. Data were presented as means±S.D. *P<0.05, **P<0.01 vs. adjacent age group.
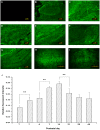
Figure 3. Localization of TRPC6 in mouse hippocampus during the postnatal development.
The immunohistochemical staining showed that TRPC6 was expressed in all regions of the hippocampus at P1 (B), P3 (C), P5 (D), P7 (E), P14 (F) and P21 (G). The negative control image was shown in (A). Scale bar, 200 µm. In suit hybridization of P1 (H) and P5 (I) brain sections showed the expression of TRPC6 in hippocampal neurons. Scale bar, 100 µm. The corresponding linear diagram of relative fluorescent intensity in glomeruli was shown in (J). Data were presented as means±S.D. n = 6/group. *P<0.05, **P<0.01 vs. adjacent age group.
Figure 4. The immunoblot analysis of TRPC6 in mouse hippocampus during the development.
Total lysates of tissues treated as indicated blotted with antibodies to TRPC6 at the indicated ages (A). Quantitative determination of TRPC6 expression showed an abrupt increase between P7 and P14 in mouse renal cortex during the development, and expression levels remained higher into adulthood (B). The expression of TRPC6 was normalized to β-actin expression. Data were presented as means±S.D. *P<0.05, **P<0.01 vs. adjacent age group.
Similar articles
- Different expressions of large-conductance Ca2+-activated K+ channels in the mouse renal cortex and hippocampus during postnatal development.
Xu P, Li Z, Xuan Q, Yang Z. Xu P, et al. Appl Immunohistochem Mol Morphol. 2015 Feb;23(2):146-52. doi: 10.1097/PAI.0000000000000006. Appl Immunohistochem Mol Morphol. 2015. PMID: 25390352 - The expression of EPOR in renal cortex during postnatal development.
Xiao L, Li Z, Xu P, Li Z, Xu J, Yang Z. Xiao L, et al. PLoS One. 2012;7(7):e41993. doi: 10.1371/journal.pone.0041993. Epub 2012 Jul 26. PLoS One. 2012. PMID: 22844537 Free PMC article. - Critical role of TRPC6 channels in the development of human renal cell carcinoma.
Song J, Wang Y, Li X, Shen Y, Yin M, Guo Y, Diao L, Liu Y, Yue D. Song J, et al. Mol Biol Rep. 2013 Aug;40(8):5115-22. doi: 10.1007/s11033-013-2613-4. Epub 2013 May 23. Mol Biol Rep. 2013. PMID: 23700295 - TRPC Channels in Proteinuric Kidney Diseases.
Hall G, Wang L, Spurney RF. Hall G, et al. Cells. 2019 Dec 23;9(1):44. doi: 10.3390/cells9010044. Cells. 2019. PMID: 31877991 Free PMC article. Review. - TRPC6 channel as an emerging determinant of the podocyte injury susceptibility in kidney diseases.
Ilatovskaya DV, Staruschenko A. Ilatovskaya DV, et al. Am J Physiol Renal Physiol. 2015 Sep 1;309(5):F393-7. doi: 10.1152/ajprenal.00186.2015. Epub 2015 Jun 17. Am J Physiol Renal Physiol. 2015. PMID: 26084930 Free PMC article. Review.
Cited by
- Transient Receptor Potential Canonical (TRPC) Channels: Then and Now.
Chen X, Sooch G, Demaree IS, White FA, Obukhov AG. Chen X, et al. Cells. 2020 Aug 28;9(9):1983. doi: 10.3390/cells9091983. Cells. 2020. PMID: 32872338 Free PMC article. Review. - Excessive corticosterone induces excitotoxicity of hippocampal neurons and sensitivity of potassium channels via insulin-signaling pathway.
Xia Q, Wang H, Yin H, Yang Z. Xia Q, et al. Metab Brain Dis. 2019 Feb;34(1):119-128. doi: 10.1007/s11011-018-0326-z. Epub 2018 Oct 4. Metab Brain Dis. 2019. PMID: 30284676 - Novel Mechanistic Insights and Potential Therapeutic Impact of TRPC6 in Neurovascular Coupling and Ischemic Stroke.
Shekhar S, Liu Y, Wang S, Zhang H, Fang X, Zhang J, Fan L, Zheng B, Roman RJ, Wang Z, Fan F, Booz GW. Shekhar S, et al. Int J Mol Sci. 2021 Feb 19;22(4):2074. doi: 10.3390/ijms22042074. Int J Mol Sci. 2021. PMID: 33669830 Free PMC article. Review. - Abnormal chromatin remodeling caused by ARID1A deletion leads to malformation of the dentate gyrus.
Liu PP, Lu SP, Li X, Tang GB, Liu X, Dai SK, Jiao LF, Lin XW, Li XG, Hu B, Jiao J, Teng ZQ, Han CS, Liu CM. Liu PP, et al. Cell Death Differ. 2023 Sep;30(9):2187-2199. doi: 10.1038/s41418-023-01199-w. Epub 2023 Aug 5. Cell Death Differ. 2023. PMID: 37543710 Free PMC article. - Distribution and Assembly of TRP Ion Channels.
Cheng W, Zheng J. Cheng W, et al. Adv Exp Med Biol. 2021;1349:111-138. doi: 10.1007/978-981-16-4254-8_7. Adv Exp Med Biol. 2021. PMID: 35138613
References
- Nicotera P, Bano D. The enemy at the gates. Ca2+ entry through TRPM7 channels and anoxic neuronal death. Cell. 2003;115:768–770. - PubMed
- Schmitz C, Perraud AL, Johnson CO, Inabe K, Smith MK, et al. Regulation of vertebrate cellular Mg2+ homeostasis by TRPM7. Cell. 2003;114:191–200. - PubMed
- Zhang Y, Hoon MA, Chandrashekar J, Mueller KL, Cook B, et al. Coding of sweet, bitter, and umami tastes: different receptor cells sharing similar signaling pathways. Cell. 2003;112:293–301. - PubMed
- Jordt SE, Ehrlich BE. TRP channels in disease. Subcell Biochem. 2007;45:253–271. - PubMed
- Sweeney M, Yu Y, Platoshyn O, Zhang S, McDaniel SS, et al. Inhibition of endogenous TRP1 decreases capacitative Ca2+ entry and attenuates pulmonary artery smooth muscle cell proliferation. Am J Physiol Lung Cell Mol Physiol. 2002;283:L144–155. - PubMed
Publication types
MeSH terms
Substances
LinkOut - more resources
Full Text Sources
Research Materials
Miscellaneous


