Dynamics and memory of heterochromatin in living cells - PubMed (original) (raw)
Dynamics and memory of heterochromatin in living cells
Nathaniel A Hathaway et al. Cell. 2012.
Abstract
Posttranslational histone modifications are important for gene regulation, yet the mode of propagation and the contribution to heritable gene expression states remains controversial. To address these questions, we developed a chromatin in vivo assay (CiA) system employing chemically induced proximity to initiate and terminate chromatin modifications in living cells. We selectively recruited HP1α to induce H3K9me3-dependent gene silencing and describe the kinetics and extent of chromatin modifications at the Oct4 locus in fibroblasts and pluripotent cells. H3K9me3 propagated symmetrically and continuously at average rates of ~0.18 nucleosomes/hr to produce domains of up to 10 kb. After removal of the HP1α stimulus, heterochromatic domains were heritably transmitted, undiminished through multiple cell generations. Our data enabled quantitative modeling of reaction kinetics, which revealed that dynamic competition between histone marking and turnover, determines the boundaries and stability of H3K9me3 domains. This framework predicts the steady-state dynamics and spatial features of the majority of euchromatic H3K9me3 domains over the genome.
Copyright © 2012 Elsevier Inc. All rights reserved.
Figures
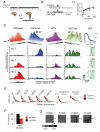
Figure 1. Design of Chromatin in vivo Assay at Oct4 (CiA:Oct4) ES cell line and mouse
(A) CIP allows direct recruitment, washout, co-occupancy, and order-of-addition experiments. (B) The CIA:Oct4 mouse contains one modified Oct4 allele harboring two arrays of DNA binding sites (12XZFHD1 and 5XGal4) in the promoter region upstream of an in-frame EGFP reporter. Distribution of histone modifications at the Oct4 locus in murine ES cells and brain tissue (Mikkelsen et al., 2007) reveals the distinct chromatin substrates for CiA modulation.
Figure 2. Kinetics of heterochromatin formation following HP1α recruitment in ES cells
A) Experimental design: rapamycin addition recruits HP1α chromoshadow fragment (csHP1α) to the CiA:Oct4 promoter. B) Schematic representation of wild-type and CiA alleles depicts location of allele-specific and common real-time PCR primers C) ChIP analysis shows rapamycin-mediated csHP1α recruitment over time. D) ChIP analysis reveals dynamic changes of active (H3K4me3, H3K27ac) and repressive (H3K9me3, HP1 gamma) chromatin modifications at the CiA:Oct4 locus. Upper panel summarizes time course of chromatin remodeling at 0h, 24h, 48h, 72h, 96h, 120h, and 192h. Data rotated 180° as indicated to display loss of active marks. Lower panels display ChIP analysis of histone modifications (y-axis) across the CiA:Oct4 locus (x-axis) at selected time points. GFP expression was measured by flow cytometry at each time point. Schematic of the reporter allele indicates _CiA:Oct4_-specific primer pairs in black. E) Dnase I sensitivity across the CiA:Oct4 locus before and after csHP1α recruitment. F) ChIP analysis of OCT4 transcription factor binding at Oct4 enhancer before and after csHP1α recruitment. G) Bisulfite sequencing analysis of DNA methylation changes at the CiA:Oct4 promoter following csHP1α targeting, with percentage methylated CpGs. White lines in schematic below mark relative positions of CpG dinucleotides.
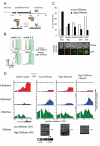
Figure 3. Maintenance of heterochromatin and heritable Oct4 repression in ES cells
A) Experimental design: rapamycin was added for either 7 days or 4.5 weeks and then washed-out with or without Dnmt-inhibitor 5azaC. B) Flow cytometry analysis after release from csHP1α after 7 days (low promoter DNAme), or after 4.5 weeks (high promoter DNAme). C) Colony growth assay tests heritability of CiA:Oct4 repression. GFP expression of individual colonies was quantified by microscopy (7 days, n=158; 4.5 weeks, n=199). D) ChIP analysis of histone modifications after rapamycin washout. The bottom panels depict bisulfite sequencing analysis of DNA methylation at CiA:Oct4 promoter after csHP1α washout for 4 days. White lines in schematic below mark relative positions of CpG dinucleotides.
Figure 4. CiA:Oct4 activation and kinetics of heterochromatin formation in MEFs
(A) CiA E14.5 p4 MEFs were infected with lentiviral constructs of either GAL4 alone or a GAL4-VP16 fusion. Puromycin was added at 48 hrs and cells analyzed by flow cytometry. (B) Experimental design: the CiA:Oct4 allele was reactivated by GAL4-VP16 in transformed CiA MEFs. GFP-positive cells were enriched by FACS and treated with rapamycin to induce csHP1α targeting. C) ChIP analysis of rapamycin-mediated csHP1α recruitment over time. D) ChIP analysis reveals dynamic changes of active (H3K4me3, H3K27ac) and repressive (H3K9me3) histone modifications at the CiA:Oct4 locus. Upper panel summarizes time course of chromatin remodeling at 0h, 24h, 48h, 72h, 96h, 120h, and 192h. Data rotated 180° as indicated to display loss of active marks. Lower panels display loss of active and gain of repressive histone modifications (y-axis) across the CiA:Oct4 locus (x-axis) at selected time points. GFP expression was measured by flow cytometry analysis at each time point.
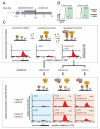
Figure 5. Maintenance of heterochromatin and dependence on transcription
A) Experimental design: the CiA:Oct4 allele was reactivated in transformed CiA MEFs by abscisic acid (ABA)-mediated recruitment of VP16. GFP-positive reactivated cells were enriched by FACS. Rapamycin was added for 7 days to recruit csHP1α. GFP-negative cells were sorted by FACS. Finally, rapamycin was washed out in the presence or absence of ABA-recruited VP16. Cells were analyzed four and eight days later. B) Flow cytometry analysis after removal of csHP1α in the presence and absence of ABA-recruited VP16. C) Cartoon depicts recruitment strategy to form heterochromatin and test its maintenance. ChIP analysis of H3K9me3 along the CiA:Oct4 allele during heterochromatin formation and after csHP1α removal with or without ABA-mediated VP16 recruitment for 4 and 8 days. H3K9me3 is maintained after rapamycin washout when not opposed by ABA-mediated transcription (P-values: * p=0.052, n/s=not significant, ** p=0.007, *** p=0.004).
Figure 6. Kinetic model of H3K9me3 dynamics
A) We consider chromatin as a one-dimensional beads-on-a-string lattice. Three processes: nucleation, propagation and turnover, yield a bounded steady-state island of marks. Nucleation occurs at the target site at rate k+. Propagation of the mark continues at sites immediately adjacent to marked sites, at rate k+. Turnover of the mark is equally likely everywhere at rate _k_−. When these processes are allowed to occur at the same time, a stochastic, bounded island of H3K9me3 marks is established at steady state. Sample output of the model with H3K9me3 domains at steady-state (right panel; each horizontal line represents a single simulation). B) Simplified kinetic scheme of H3K9me3 dynamics. Without a feedback mechanism to reinforce placement of H3K9me3 marks, the domain collapses in the absence of continued nucleation (lower panel). In the presence of a feedback mechanism that stabilizes H3K9 methylation (denoted by H3K9me3*) the domain persists. C) The profile of the steady-state island varies with κ (defined in main text). Larger values of κ increase the size of the island until κ > 1.5; above this value, the island grows without bounds. D) Fits of the experimental H3K9me3 ChIP data shown in Figure 2 to the kinetic model. Data from ES cells are best described by _κ_=1.5, while the data from MEFs are described by _κ_=1.0. E) Specific values of k+ and _k_− were obtained by fitting the simulations to a time course of integrated H3K9me3 ChIP enrichment at the locus (see Figure 2). Resulting values of k+ and _k_− are shown next to the data for each cell type. Our estimated uncertainty in these values is 35% (shaded regions). F) Clustering of genomic H3K9me3 domains in ES cells (Bilodeau et al., 2009) by _k_-means, with _k_=3. Clustering identified two predominant groups ("small" and "large" H3K9me3 domains), and a very small number of aberrant domains. G) Small H3K9me3 domains (mean ± SD) are described well by our model with _κ_=1.0. H) Large H3K9me3 domains (mean ± SD) are described well by our model with _κ_=1.4.
Comment in
- Rewriting the epigenome.
Carone BR, Rando OJ. Carone BR, et al. Cell. 2012 Jun 22;149(7):1422-3. doi: 10.1016/j.cell.2012.06.008. Cell. 2012. PMID: 22726428 - Epigenetics: detecting the dynamics and memory of heterochromatin.
Jones B. Jones B. Nat Rev Genet. 2012 Jun 26;13(8):517. doi: 10.1038/nrg3283. Nat Rev Genet. 2012. PMID: 22733305 No abstract available. - Writing the histone code.
Rusk N. Rusk N. Nat Methods. 2012 Aug;9(8):777. doi: 10.1038/nmeth.2116. Nat Methods. 2012. PMID: 23019686 No abstract available.
Similar articles
- Contribution of promoter DNA sequence to heterochromatin formation velocity and memory of gene repression in mouse embryo fibroblasts.
Vignaux PA, Bregio C, Hathaway NA. Vignaux PA, et al. PLoS One. 2019 Jul 3;14(7):e0217699. doi: 10.1371/journal.pone.0217699. eCollection 2019. PLoS One. 2019. PMID: 31269077 Free PMC article. - HP1 recruits activity-dependent neuroprotective protein to H3K9me3 marked pericentromeric heterochromatin for silencing of major satellite repeats.
Mosch K, Franz H, Soeroes S, Singh PB, Fischle W. Mosch K, et al. PLoS One. 2011 Jan 18;6(1):e15894. doi: 10.1371/journal.pone.0015894. PLoS One. 2011. PMID: 21267468 Free PMC article. - The interplay between H2A.Z and H3K9 methylation in regulating HP1α binding to linker histone-containing chromatin.
Ryan DP, Tremethick DJ. Ryan DP, et al. Nucleic Acids Res. 2018 Oct 12;46(18):9353-9366. doi: 10.1093/nar/gky632. Nucleic Acids Res. 2018. PMID: 30007360 Free PMC article. - Role of H3K9me3 heterochromatin in cell identity establishment and maintenance.
Nicetto D, Zaret KS. Nicetto D, et al. Curr Opin Genet Dev. 2019 Apr;55:1-10. doi: 10.1016/j.gde.2019.04.013. Epub 2019 May 16. Curr Opin Genet Dev. 2019. PMID: 31103921 Free PMC article. Review. - H3K9me3-Dependent Heterochromatin: Barrier to Cell Fate Changes.
Becker JS, Nicetto D, Zaret KS. Becker JS, et al. Trends Genet. 2016 Jan;32(1):29-41. doi: 10.1016/j.tig.2015.11.001. Epub 2015 Dec 8. Trends Genet. 2016. PMID: 26675384 Free PMC article. Review.
Cited by
- DNA methylation: roles in mammalian development.
Smith ZD, Meissner A. Smith ZD, et al. Nat Rev Genet. 2013 Mar;14(3):204-20. doi: 10.1038/nrg3354. Epub 2013 Feb 12. Nat Rev Genet. 2013. PMID: 23400093 Review. - Atrx promotes heterochromatin formation at retrotransposons.
Sadic D, Schmidt K, Groh S, Kondofersky I, Ellwart J, Fuchs C, Theis FJ, Schotta G. Sadic D, et al. EMBO Rep. 2015 Jul;16(7):836-50. doi: 10.15252/embr.201439937. Epub 2015 May 26. EMBO Rep. 2015. PMID: 26012739 Free PMC article. - Chromatin loops, gene positioning, and gene expression.
Holwerda S, de Laat W. Holwerda S, et al. Front Genet. 2012 Oct 17;3:217. doi: 10.3389/fgene.2012.00217. eCollection 2012. Front Genet. 2012. PMID: 23087710 Free PMC article. - Generalized nucleation and looping model for epigenetic memory of histone modifications.
Erdel F, Greene EC. Erdel F, et al. Proc Natl Acad Sci U S A. 2016 Jul 19;113(29):E4180-9. doi: 10.1073/pnas.1605862113. Epub 2016 Jul 5. Proc Natl Acad Sci U S A. 2016. PMID: 27382173 Free PMC article. - Repressing Gene Transcription by Redirecting Cellular Machinery with Chemical Epigenetic Modifiers.
Chiarella AM, Wang TA, Butler KV, Jin J, Hathaway NA. Chiarella AM, et al. J Vis Exp. 2018 Sep 20;(139):58222. doi: 10.3791/58222. J Vis Exp. 2018. PMID: 30295665 Free PMC article.
References
- Bannister AJ, Zegerman P, Partridge JF, Miska EA, Thomas JO, Allshire RC, Kouzarides T. Selective recognition of methylated lysine 9 on histone H3 by the HP1 chromo domain. Nature. 2001;410:120–124. - PubMed
- Bock C, Reither S, Mikeska T, Paulsen M, Walter J, Lengauer T. BiQ Analyzer: visualization and quality control for DNA methylation data from bisulfite sequencing. Bioinformatics. 2005;21:4067–4068. - PubMed
Publication types
MeSH terms
Substances
Grants and funding
- F32HD072627/HD/NICHD NIH HHS/United States
- NS046789/NS/NINDS NIH HHS/United States
- R01 NS046789/NS/NINDS NIH HHS/United States
- R01 HD055391/HD/NICHD NIH HHS/United States
- R37 NS046789/NS/NINDS NIH HHS/United States
- HHMI/Howard Hughes Medical Institute/United States
- F32 HD072627/HD/NICHD NIH HHS/United States
- HD55391/HD/NICHD NIH HHS/United States
- AI060037/AI/NIAID NIH HHS/United States
- R01 AI060037/AI/NIAID NIH HHS/United States
LinkOut - more resources
Full Text Sources
Other Literature Sources
Molecular Biology Databases
Research Materials


