A cell-autonomous defect in skeletal muscle satellite cells expressing low levels of survival of motor neuron protein - PubMed (original) (raw)
A cell-autonomous defect in skeletal muscle satellite cells expressing low levels of survival of motor neuron protein
Monica Hayhurst et al. Dev Biol. 2012.
Abstract
Mutations in the Survival of Motor Neuron (SMN) gene underlie the development of spinal muscular atrophy (SMA), which currently represents the leading genetic cause of mortality in infants and toddlers. SMA is characterized by degeneration of spinal cord motor neurons and muscle atrophy. Although SMA is often considered to be a motor neuron disease, accumulating evidence suggests that muscle cells themselves may be affected by low levels of SMN. Here, we examine satellite cells, tissue-resident stem cells that play an essential role in the growth and repair of skeletal muscle, isolated from a severe SMA mouse model (Smn(-/-); SMN2(+/+)). We found similar numbers of satellite cells in the muscles of SMA and wild-type (Smn(+/+); SMN2(+/+)) mice at postnatal day 2 (P2), and, when isolated from skeletal muscle using cell surface marker expression, these cells showed comparable survival and proliferative potential. However, SMA satellite cells differentiate abnormally, revealed by the premature expression of muscle differentiation markers, and, especially, by a reduced efficiency in forming myotubes. These phenotypes suggest a critical role of SMN protein in the intrinsic regulation of muscle differentiation and suggest that abnormal muscle development contributes to the manifestation of SMA symptoms.
Copyright © 2012 Elsevier Inc. All rights reserved.
Figures
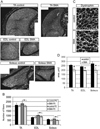
Fig. 1. Smn deficient animals have fewer and smaller myofibers
(A) Individual TA, EDL, and soleus muscles from control and SMA mice were stained with an anti-dystrophin antibody to visualize individual muscle fibers. (B) Quantitation of fiber number in the TA, EDL, and soleus muscles revealed that SMA mice have significantly fewer fibers in all muscle groups at P2, but not at P0. (C) Higher magnification micrograph of muscle cross sections after dystrophin staining. Scalebar 10 uM. (D) The average area per muscle fiber was significantly reduced in TA, EDL, and soleus muscles. *P < 0.05, paired _t_-test. Data are presented as mean ± s.d.
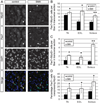
Fig. 2. Smn deficient satellite cells differentiate prematurely in vivo
Sections from 3 muscles of P2 mice were co-stained with anti-Pax7 and anti-MyoD antibodies. (A) Representative images from the EDL muscle showing staining for Pax7 (green in merged image) MyoD (red in merged image) and DAPI (blue in merged image). We classified cells as Pax7+/MyoD− satellite cells (labeled 1) or Pax7+MyoD+ myogenic progenitors (labeled 2) and quantified them in comparable transverse sections of all three muscle groups. (B) There is a large number of Pax7+/MyoD− cells per fiber in all SMA muscle groups. (C) All SMA muscle groups had significantly higher numbers of Pax7+/MyoD+ cells per fiber. (D)The percentage of Pax7+ cells that are also MyoD+ is also elevated in SMA muscle. *P < 0.05, paired _t_-test. **P < 0.005, paired _t_-test. Data are presented as mean ± s.d. (For interpretation of the references to color in this figure legend, the reader is referred to the web version of this article.)
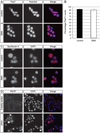
Fig. 3. Freshly sorted satellite cells express the satellite cell markers Pax7 and Syndecan −4
(A) Pax7 immunostaining (red in merged image) was performed on freshly isolated satellite cells from P2 control and SMA muscle. Nuclei were labeled with DAPI (blue in merged image). (B) Quantitation of the percentage of Pax7+ nuclei from freshly sorted satellite cells. Data are presented as mean ± s.d. All freshly sorted cells from both types of P2 muscle were Syndecan-4 positive (C; red in merged image) and MyoD negative (D; red in merged image). (D) Freshly sorted satellite cells were MyoD negative, but after four days (DIV4) in culture, cells began to express MyoD. Nuclei were marked with DAPI (blue in merged image). (For interpretation of the references to color in this figure legend, the reader is referred to the web version of this article.)
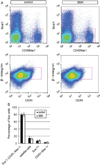
Fig. 4. Normal frequencies of myofiber-associated cells isolated from SMA mice
(A) Representative plots showing FACS analyses of myofiber-associated cells from P2 control and SMA muscle. (B) Quantification of the percentage of each subpopulation with respect to the total viable population (calcein positive and propidium iodide negative). The frequencies of Sca-1−;CD45−;Mac-1− cells, satellite cells (CXCR4+;β-integrin+), fibroblasts and adipogenic precursor cells (Sca-1+), and hematopoietic cells (CD45 +;Mac-1+) were comparable between control and SMA muscle. Data are presented as mean ± s.d.
Fig. 5. Sorted satellite cells have normal survival and proliferation
(A) Quantitation of the efficiency of colony formation of sorted cells. (B) Quantification of the number of cells per clone. Data are presented as mean ± s.d. (C) Percentage of clones with indicated number of cells per clone. All measurements were made on DIV4.
Fig. 6. SMN deficient satellite cells prematurely exhibit a bipolar, myoblast morphology
(A) Brightfield images of satellite cell derived cultures on DIV4. Cells appear to adopt either a round or bipolar morphology. Round cells are marked with a black arrow; bipolar, myoblast-like cells are marked with a white arrow. (B) The frequency of cells with a myoblast-like morphology was higher in SMA muscle cultures on DIV4. (C) Cultures were stained on DIV2 and DIV4 with an anti-Pax7 antibody to quantify the frequency of satellite cells remaining in the cultures. The percentage of Pax7 positive nuclei was comparable in the two different types of cultures on both days. *P < 0.005, paired _t_-test. Data presented as mean ± s.d.
Fig. 7. SMN deficient cells express myogenic markers more quickly
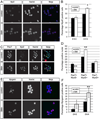
(A) Representative images of DIV4 cultured cells stained for MyoD expression (red in merged image). Nuclei are marked by DAPI (blue in merged image). (B) A greater percentage of cells are MyoD+ in SMA cultures on DIV4, but not on DIV2. (C) Co-staining with anti-Pax7 and anti-MyoD antibodies in DIV4 cultures reveals cells that: express Pax7 only (1, green in merged image), MyoD only (2, red in merged image), or both Pax7 and MyoD. Nuclei are marked by DAPI (blue in merged image). (D) DIV4 SMA muscle cultures have fewer Pax7+/MyoD− cells, but a higher frequency of Pax7+/MyoD+ cells. The percentage of Pax7−/MyoD+ cells is similar in the two cultures. (E) Representative images of DIV4 cultured cells stained for myogenin (red in merged image). Nuclei are marked by Hoechst (blue in merged image). (F) SMA muscle cultures have a higher percentage of myogenin positive cells at DIV4. *P < 0.05, paired _t_-test. **P < 0.005, paired _t_-test. Data presented as mean ± s.d. (For interpretation of the references to color in this figure legend, the reader is referred to the web version of this article.)
Fig. 8. SMN deficient satellite cells grown under differentiation conditions form fewer myotubes
(A) Representative images showing staining of MyHC+ cells (green) in cultures grown in differentiation media (DM) for 2 and 3 days. Nuclei are marked with Hoechst (blue). (B) Myotubes were defined as cells containing 2 or more nuclei in a MyHC positive cytoplasm. After 3 days in DM, control cells form significantly more myotubes than SMA cells. (C) The frequency of MyHC positive cells is elevated in SMN deficient cultures 2 days after treatment with DM but is reduced after 3 days in DM when cells fail to form myotubes efficiently. (D) There is also a reduction in myotube formation in the SMA cultures when measured as the percentage of nuclei found in myotubes. *P < 0.05, paired _t_-test. **P < 0.005, paired _t_-test. Data represent mean ± s.d. (For interpretation of the references to color in this figure legend, the reader is referred to the web version of this article.)
Similar articles
- SMN depletion impairs skeletal muscle formation and maturation in a mouse model of SMA.
Liu H, Chehade L, Deguise MO, De Repentigny Y, Kothary R. Liu H, et al. Hum Mol Genet. 2025 Jan 23;34(1):21-31. doi: 10.1093/hmg/ddae162. Hum Mol Genet. 2025. PMID: 39505369 Free PMC article. - Normalization of Patient-Identified Plasma Biomarkers in SMNΔ7 Mice following Postnatal SMN Restoration.
Arnold WD, Duque S, Iyer CC, Zaworski P, McGovern VL, Taylor SJ, von Herrmann KM, Kobayashi DT, Chen KS, Kolb SJ, Paushkin SV, Burghes AH. Arnold WD, et al. PLoS One. 2016 Dec 1;11(12):e0167077. doi: 10.1371/journal.pone.0167077. eCollection 2016. PLoS One. 2016. PMID: 27907033 Free PMC article. - SAHA ameliorates the SMA phenotype in two mouse models for spinal muscular atrophy.
Riessland M, Ackermann B, Förster A, Jakubik M, Hauke J, Garbes L, Fritzsche I, Mende Y, Blumcke I, Hahnen E, Wirth B. Riessland M, et al. Hum Mol Genet. 2010 Apr 15;19(8):1492-506. doi: 10.1093/hmg/ddq023. Epub 2010 Jan 22. Hum Mol Genet. 2010. PMID: 20097677 - The Biochemistry of Survival Motor Neuron Protein Is Paving the Way to Novel Therapies for Spinal Muscle Atrophy.
Lomonte P, Baklouti F, Binda O. Lomonte P, et al. Biochemistry. 2020 Apr 14;59(14):1391-1397. doi: 10.1021/acs.biochem.9b01124. Epub 2020 Apr 2. Biochemistry. 2020. PMID: 32227847 Review. - SMN-inducing compounds for the treatment of spinal muscular atrophy.
Lorson MA, Lorson CL. Lorson MA, et al. Future Med Chem. 2012 Oct;4(16):2067-84. doi: 10.4155/fmc.12.131. Future Med Chem. 2012. PMID: 23157239 Free PMC article. Review.
Cited by
- Requirement of enhanced Survival Motoneuron protein imposed during neuromuscular junction maturation.
Kariya S, Obis T, Garone C, Akay T, Sera F, Iwata S, Homma S, Monani UR. Kariya S, et al. J Clin Invest. 2014 Feb;124(2):785-800. doi: 10.1172/JCI72017. Epub 2014 Jan 27. J Clin Invest. 2014. PMID: 24463453 Free PMC article. - Systemic peptide-mediated oligonucleotide therapy improves long-term survival in spinal muscular atrophy.
Hammond SM, Hazell G, Shabanpoor F, Saleh AF, Bowerman M, Sleigh JN, Meijboom KE, Zhou H, Muntoni F, Talbot K, Gait MJ, Wood MJ. Hammond SM, et al. Proc Natl Acad Sci U S A. 2016 Sep 27;113(39):10962-7. doi: 10.1073/pnas.1605731113. Epub 2016 Sep 12. Proc Natl Acad Sci U S A. 2016. PMID: 27621445 Free PMC article. - Mitochondrial Dysfunction in Spinal Muscular Atrophy.
Zilio E, Piano V, Wirth B. Zilio E, et al. Int J Mol Sci. 2022 Sep 17;23(18):10878. doi: 10.3390/ijms231810878. Int J Mol Sci. 2022. PMID: 36142791 Free PMC article. Review. - A link between agrin signalling and Cav3.2 at the neuromuscular junction in spinal muscular atrophy.
Delers P, Sapaly D, Salman B, De Waard S, De Waard M, Lefebvre S. Delers P, et al. Sci Rep. 2022 Nov 8;12(1):18960. doi: 10.1038/s41598-022-23703-x. Sci Rep. 2022. PMID: 36347955 Free PMC article. - Role of stem/progenitor cells in reparative disorders.
Pretheeban T, Lemos DR, Paylor B, Zhang RH, Rossi FM. Pretheeban T, et al. Fibrogenesis Tissue Repair. 2012 Dec 27;5(1):20. doi: 10.1186/1755-1536-5-20. Fibrogenesis Tissue Repair. 2012. PMID: 23270300 Free PMC article.
References
- Blanco-Bose WE, Yao CC, Kramer RH, Blau HM. Purification of mouse primary myoblasts based on alpha 7 integrin expression. Exp. Cell Res. 2001;265:212–220. - PubMed
- Braun S, Croizat B, Lagrange MC, Warter JM, Poindron P. Constitutive muscular abnormalities in culture in spinal muscular atrophy. Lancet. 1995;345:694–695. - PubMed
Publication types
MeSH terms
Substances
Grants and funding
- P01 NS066888/NS/NINDS NIH HHS/United States
- HHMI/Howard Hughes Medical Institute/United States
- P30 DK036836/DK/NIDDK NIH HHS/United States
- P01NS066888-01A1/NS/NINDS NIH HHS/United States
- P30DK036836/DK/NIDDK NIH HHS/United States
LinkOut - more resources
Full Text Sources
Other Literature Sources
Medical
Molecular Biology Databases
