Analysis of Helicobacter pylori cagA promoter elements required for salt-induced upregulation of CagA expression - PubMed (original) (raw)
Analysis of Helicobacter pylori cagA promoter elements required for salt-induced upregulation of CagA expression
John T Loh et al. Infect Immun. 2012 Sep.
Abstract
Helicobacter pylori infection and consumption of a high-salt diet are each associated with an increased risk for the development of gastric cancer. To investigate potential synergism between these factors, we used a global proteomic approach to analyze H. pylori strains cultured in media containing varying salt concentrations. Among the differentially expressed proteins identified, CagA exhibited the greatest increase in expression in response to high salt concentrations. Analysis of 36 H. pylori strains isolated from patients in two regions of Colombia with differing incidences of gastric cancer revealed marked differences among strains in salt-responsive CagA expression. Sequence analysis of the cagA promoter region in these strains revealed a DNA motif (TAATGA) that was present in either one or two copies. Salt-induced upregulation of CagA expression was detected more commonly in strains containing two copies of the TAATGA motif than in strains containing one copy. Mutagenesis experiments confirmed that two copies of the TAATGA motif are required for salt-induced upregulation of CagA expression. In summary, there is considerable heterogeneity among H. pylori strains in salt-regulated CagA expression, and these differences are attributable to variation in a specific DNA motif upstream of the cagA transcriptional start site.
Figures
Fig 1
Proteomic analysis of H. pylori strain 26695 cultured in media containing varying NaCl concentrations. H. pylori 26695 was cultured for 15 h in media containing varying NaCl concentrations (BB-FBS-0.25%, BB-FBS-0.5%, or BB-FBS-1.25%). Cell lysates were generated and were subjected to 2D-DIGE analysis as described in Materials and Methods. (A) Unsupervised principal component analysis was used to assess differences in protein expression patterns among 12 samples (quadruplicate samples of H. pylori 26695 grown in BB-FBS-0.25%, BB-FBS-0.5%, or BB-FBS-1.25%). In total, 977 resolved protein spot features were matched across gels and were quantified. The first principal component (PC1), comprising 29% of the variation, did not distinguish between the three growth states (low, normal, and high salt concentrations). (B) Principal component analyses of 68 protein features that were altered in expression in any one of the three groups of samples relative to the others (based on P values of <0.05 by ANOVA). PC1 comprises >62% of the variation among the 68 features in this subset and distinguishes between bacteria grown under high-salt conditions and those grown under low- or medium-salt conditions. (C) Sypro ruby stain of a representative 2D-DIGE gel (pH 4 to 7) containing three differentially labeled samples as described in Materials and Methods. (D) Graph comparing CagA abundance between the three growth states (low, normal, and high salt concentrations). Standardized log abundance (y axis) was calculated relative to the signals from the Cy2-labeled internal standard described in Materials and Methods.
Fig 2
Real-time PCR analysis of transcripts corresponding to differentially expressed proteins identified in the proteomic analysis. H. pylori 26695 was cultured for 15 h in BB-FBS-0.5% or BB-FBS-1.25%. Bacterial RNA was isolated and processed, and real-time PCR was performed as described in Materials and Methods to assess the transcription of genes encoding proteins that were identified as differentially expressed, based on 2D-DIGE analysis. The transcript levels of each gene were normalized to the transcript levels of 16S rRNA. For each gene, normalized transcript values from bacteria grown under high salt-conditions (BB-FBS-1.25%) were compared to the corresponding values from bacteria grown under normal salt conditions (BB-FBS-0.5%) to yield a fold change value. The dashed line is provided as a reference and indicates a value of 1 (no change). The results shown (mean ± standard deviation) are from a single experiment with triplicate samples. The experiment was repeated 3 times with similar results. Asterisks indicate genes for which the transcript levels in bacteria cultured under high-salt conditions were significantly different from the transcript levels in bacteria cultured under normal salt conditions (P, <0.05 by Student's t test).
Fig 3
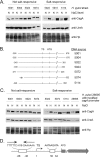
Heterogeneity among H. pylori strains in salt-regulated CagA expression. Salt-regulated expression of CagA was analyzed in H. pylori strains isolated from patients in regions of Colombia with a low risk (strains 5001, 5004, 5022, 5024) or a high risk (strains 5072, 5074, 5114) for gastric cancer. (A) H. pylori strains were cultured for 15 h in BB-FBS-0.5% (N, normal salt concentration) or BB-FBS-1.1% (H, high salt concentration). Cell extracts were standardized by protein concentration, and 5-μg aliquots were analyzed by SDS-PAGE and immunoblotting with an anti-CagA antibody (1:6,000). Consistent with previous results, CagA was visualized as either a single band or a doublet, and these bands were absent in cagA mutant strains (25). The basis for the appearance of a doublet in some cases is not known. Blots then were stripped and reprobed sequentially with an anti-UreA antiserum (1:10,000) and an anti-H. pylori antiserum (1:10,000). (B) H. pylori 26695 cagA::_catrdx_-9 was transformed with 1.2-kb DNA fragments (500 bp upstream and 700 bp downstream of the cagA transcriptional start site) derived from the indicated Colombian strains. The schematic illustrates chromosomal regions that were altered in the resulting transformants. Nucleotide numbers are relative to the cagA transcriptional start site and designate the chromosomal regions in H. pylori 26695 that were replaced with sequences derived from Colombian strains. Vertical lines indicate the cagA transcriptional start site (TS) and the cagA ATG translation initiation site. (C) The transformants schematized in panel B were cultured and analyzed for CagA expression as described for panel A. (D) Schematic illustrating an AT-rich inverse repeat in the cagA promoter region of H. pylori 26695, the cagA TS, an AATAAGATA motif associated with high basal CagA expression levels, and the cagA ATG translation initiation site.
Fig 4
Relationships between salt-responsive CagA expression and site of H. pylori isolation, MLST type, basal level of CagA expression, and gastric histopathology score. This figure analyzes H. pylori strains isolated from patients living in regions of Colombia with either a low or a high risk for gastric cancer. H. pylori strains were cultured for 15 h in BB-FBS-0.5% or BB-FBS-1.1%. CagA expression in each strain was then analyzed by immunoblotting with an anti-CagA antibody and was quantified as described in Materials and Methods. For each strain, the effect of salt on CagA expression is expressed as a CagA induction value, which was calculated by comparing CagA expression levels under high-salt conditions (BB-FBS-1.1%) with those under lower-salt conditions (BB-FBS-0.5%). (A) Relationship between salt-responsive CagA expression and site of strain isolation (locations in Colombia with a high or a low risk for gastric cancer). (B) Relationship between salt-responsive CagA expression and the ancestral origin of the H. pylori strains, based on MLST analysis. The European strains in this analysis were subdivided according to whether they were isolated from regions of low or high cancer risk. (C) Relationship between salt-responsive CagA expression and basal levels of CagA expression (i.e., levels of CagA expressed when bacteria were cultured in BB-FBS-0.5%). Twenty strains had low basal levels of CagA expression (CagA expression levels, <2.0 compared to strain 5001), and 16 strains had higher basal levels of CagA expression (CagA expression levels, ≥2.0 relative to strain 5001) (23). (D, E, and F) Relationship between salt-responsive CagA expression and gastric histopathology score. The 20 strains analyzed in panels D and E all had low basal levels of CagA expression, and the 16 strains analyzed in panel F had higher basal levels of CagA expression, as described above for panel C. Panel E analyzes a relationship between gastric histology scores and salt-responsive CagA expression (histology scores of <3.0 correspond to nonatrophic gastritis [10 strains]; scores of ≥3.0 correspond to precancerous lesions [10 strains]). Mean fold induction values ± standard deviations are shown in panels A, B, C, and E. P values were determined by using Student's t test, and _r_2 values were determined by linear regression analysis.
Fig 5
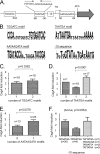
Relationship between salt-responsive CagA expression and strain-specific sequence variation in the region upstream of cagA. (A) Nucleotide sequence analysis of the region upstream of the cagA ATG initiation site in 36 Colombian H. pylori strains (23) revealed 4 regions that differed substantially among the strains. (B) Nucleotide sequence variation in these regions among the 36 strains is shown by WebLogo analysis. Each position in the alignment is represented by a stack of letters (nucleotides); the height of each letter is proportional to the observed frequency of each nucleotide. (C to F) Correlation of salt-responsive CagA expression with the number of TGGATC motifs (C), TAATGA motifs (D), or AATAAGATA motifs (E) and the type of −10 sequence (F). P values were calculated using the t test (C to E) or ANOVA (F). For each strain, salt-responsive CagA expression is shown as a “CagA fold induction value,” calculated by comparing CagA expression levels under high-salt conditions (BB-FBS-1.1%) with those under lower-salt conditions (BB-FBS-0.5%).
Fig 6
Strain-specific sequence variation in the cagA promoter region. This figure illustrates the TAATGA motif contained within an inverted repeat in the cagA promoter region. H. pylori strains 5022, 5072, 5114, and 26695 exhibited salt-regulated CagA expression, whereas strains 5001, 5004, 5024, and 5074 did not. The TAATGA motifs are in a larger font, and the nucleotides constituting the inverted repeat are underlined. The TAATGA motif is present in either 1 or 2 copies in the strains shown. The arrow indicates the cagA transcriptional start site (TS).
Fig 7
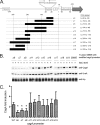
Analysis of CagA expression in strain 26695 mutants harboring deletions in the region upstream of the cagA transcriptional start site. (A) Cloned cagA fragments harboring deletions upstream of the cagA transcriptional start site were transformed into H. pylori 26695 cagA::_catrdx_-9. The filled rectangles represent the segments of DNA that were deleted. The locations of a TGGATC motif, a TAATGA motif, the cagA transcriptional start (TS), a AATAAGATA motif, and the cagA translation initiation site (ATG) are shown. (B) H. pylori 26695 cagA::_catrdx_-9 transformants harboring the indicated deletions in the cagA promoter region were cultured for 15 h in BB-FBS-0.5% (N, normal salt) or BB-FBS-1.1% (H, high salt). Lysates were generated as described in Materials and Methods and were standardized by protein concentration, and 5-μg aliquots were analyzed by Western blotting to detect CagA expression. (C) The levels of salt-induced CagA expression (CagA induction values) detected in the wild-type strain and mutants containing deletions in the cagA promoter region are shown. CagA induction values were calculated by comparing CagA expression levels under high-salt conditions (BB-FBS-1.1%) with those under lower-salt conditions (BB-FBS-0.5%). A minimum of 3 biological samples for each strain were analyzed. The mean CagA fold induction values ± standard errors are shown. The asterisks represent results that are significantly different from those for the wild-type strain (P, <0.005 by Student's t test).
Fig 8
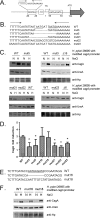
Identification of sequences required for salt-responsive CagA expression. This figure analyzes the effects of mutations to the TAATGA and AATAAGATA motifs on salt-responsive CagA expression. (A) Schematic illustrating the locations of the TAATGA and AATAAGATA motifs relative to the predicted cagA transcriptional start site (TS) and cagA ATG translation initiation site. (B) A cloned DNA segment containing 0.6 kb of DNA upstream and 0.6 kb downstream of the cagA transcriptional start site was mutated so that the indicated nucleotide changes (designated mut3, mut5, mut21, mut22, and mut23) were introduced into the inverted-repeat region (panel A) upstream of the cagA transcriptional start site. These mutations were then introduced into the corresponding chromosomal region upstream of cagA in H. pylori 26695 cagA::_catrdx_-9. (C) H. pylori mutants were cultured for 15 h in BB-FBS-0.5% (N, normal salt) or BB-FBS-1.1% (H, high salt). The bacteria were then harvested and lysed, and Western blotting was performed as described in Materials and Methods. (D) Levels of salt-induced CagA expression (CagA induction values) detected in the wild-type strain and mutants. CagA induction values were calculated by comparing CagA expression levels under high-salt conditions (BB-FBS-1.1%) with those under lower-salt conditions (BB-FBS-0.5%). Features of mut3, mut5, mut21, mut22, and mut23 are shown in panel B, and features of mut16 and mut18 are shown in panel E. The mean CagA induction value ± standard error was calculated based on a minimum of 6 biological samples for each strain. The asterisks represent results that are significantly different (P, <0.005 by Student's t test) from that observed for the wild-type strain. (E) Mutations were introduced to either delete (mut16) or mutate (mut18) the AATAAGATA motif found downstream of the cagA transcriptional start site (panel A). (F) Mutated plasmids harboring the mut16 and mut18 mutations were transformed into strain H. pylori 26695 cagA::_catrdx_-9, and transformants harboring the desired mutations were screened for salt-responsive CagA expression by Western blot analysis as described for panel C.
Similar articles
- Analysis of cagA in Helicobacter pylori strains from Colombian populations with contrasting gastric cancer risk reveals a biomarker for disease severity.
Loh JT, Shaffer CL, Piazuelo MB, Bravo LE, McClain MS, Correa P, Cover TL. Loh JT, et al. Cancer Epidemiol Biomarkers Prev. 2011 Oct;20(10):2237-49. doi: 10.1158/1055-9965.EPI-11-0548. Epub 2011 Aug 22. Cancer Epidemiol Biomarkers Prev. 2011. PMID: 21859954 Free PMC article. - Regulation of Helicobacter pylori cagA expression in response to salt.
Loh JT, Torres VJ, Cover TL. Loh JT, et al. Cancer Res. 2007 May 15;67(10):4709-15. doi: 10.1158/0008-5472.CAN-06-4746. Cancer Res. 2007. PMID: 17510398 - Dynamic Expansion and Contraction of cagA Copy Number in Helicobacter pylori Impact Development of Gastric Disease.
Jang S, Su H, Blum FC, Bae S, Choi YH, Kim A, Hong YA, Kim J, Kim JH, Gunawardhana N, Jeon YE, Yoo YJ, Merrell DS, Ge L, Cha JH. Jang S, et al. mBio. 2017 Feb 21;8(1):e01779-16. doi: 10.1128/mBio.01779-16. mBio. 2017. PMID: 28223454 Free PMC article. - Analysis of the 3'-variable region of the cagA gene from Helicobacter pylori strains infecting patients at New York City hospitals.
Ogorodnik E, Raffaniello RD. Ogorodnik E, et al. Microb Pathog. 2013 Mar;56:29-34. doi: 10.1016/j.micpath.2012.10.003. Epub 2012 Oct 29. Microb Pathog. 2013. PMID: 23117095 - [Genotyping of Helicobacter pylori virulence factors vacA and cagA in individuals from two regions in Colombia with opposing risk for gastric cancer].
Trujillo E, Martínez T, Bravo MM. Trujillo E, et al. Biomedica. 2014 Oct-Dec;34(4):567-73. doi: 10.1590/S0120-41572014000400009. Biomedica. 2014. PMID: 25504245 Spanish.
Cited by
- Infiltration to infection: key virulence players of Helicobacter pylori pathogenicity.
Bhattacharjee A, Sahoo OS, Sarkar A, Bhattacharya S, Chowdhury R, Kar S, Mukherjee O. Bhattacharjee A, et al. Infection. 2024 Apr;52(2):345-384. doi: 10.1007/s15010-023-02159-9. Epub 2024 Jan 25. Infection. 2024. PMID: 38270780 Review. - Effect of environmental salt concentration on the Helicobacter pylori exoproteome.
Caston RR, Loh JT, Voss BJ, McDonald WH, Scholz MB, McClain MS, Cover TL. Caston RR, et al. J Proteomics. 2019 Jun 30;202:103374. doi: 10.1016/j.jprot.2019.05.002. Epub 2019 May 4. J Proteomics. 2019. PMID: 31063819 Free PMC article. - Gastric cáncer: Overview.
Piazuelo MB, Correa P. Piazuelo MB, et al. Colomb Med (Cali). 2013 Sep 30;44(3):192-201. eCollection 2013 Jul. Colomb Med (Cali). 2013. PMID: 24892619 Free PMC article. Review. - Virulence Genes of Helicobacter pylori Increase the Risk of Premalignant Gastric Lesions in a Colombian Population.
Carlosama-Rosero Y, Acosta-Astaiza C, Sierra-Torres CH, Bolaños-Bravo H, Quiroga-Quiroga A, Bonilla-Chaves J. Carlosama-Rosero Y, et al. Can J Gastroenterol Hepatol. 2022 Sep 28;2022:7058945. doi: 10.1155/2022/7058945. eCollection 2022. Can J Gastroenterol Hepatol. 2022. PMID: 36212919 Free PMC article. - Helicobacter pylori in gastric carcinogenesis: mechanisms.
Wroblewski LE, Peek RM Jr. Wroblewski LE, et al. Gastroenterol Clin North Am. 2013 Jun;42(2):285-98. doi: 10.1016/j.gtc.2013.01.006. Epub 2013 Mar 6. Gastroenterol Clin North Am. 2013. PMID: 23639641 Free PMC article. Review.
References
- Amieva MR, El-Omar EM. 2008. Host-bacterial interactions in Helicobacter pylori infection. Gastroenterology 134:306–323 - PubMed
- Backert S, Tegtmeyer N, Selbach M. 2010. The versatility of Helicobacter pylori CagA effector protein functions: the master key hypothesis. Helicobacter 15:163–176 - PubMed
- Basso D, et al. 2008. Clinical relevance of Helicobacter pylori cagA and vacA gene polymorphisms. Gastroenterology 135:91–99 - PubMed
Publication types
MeSH terms
Substances
Grants and funding
- CA028842/CA/NCI NIH HHS/United States
- R01 CA077955/CA/NCI NIH HHS/United States
- R29 CA077955/CA/NCI NIH HHS/United States
- P01 CA116087/CA/NCI NIH HHS/United States
- CA116087/CA/NCI NIH HHS/United States
- I01 BX001453/BX/BLRD VA/United States
- R01 AI039657/AI/NIAID NIH HHS/United States
- R01 AI068009/AI/NIAID NIH HHS/United States
- R01 DK053620/DK/NIDDK NIH HHS/United States
- P01 CA028842/CA/NCI NIH HHS/United States
- P30 DK058404/DK/NIDDK NIH HHS/United States
- CA77955/CA/NCI NIH HHS/United States
- R01 DK058587/DK/NIDDK NIH HHS/United States
- AI039657/AI/NIAID NIH HHS/United States
- DK058404/DK/NIDDK NIH HHS/United States
- DK58587/DK/NIDDK NIH HHS/United States
- AI068009/AI/NIAID NIH HHS/United States
LinkOut - more resources
Full Text Sources
Other Literature Sources


