Super-resolution imaging of aquaporin-4 orthogonal arrays of particles in cell membranes - PubMed (original) (raw)
. 2012 Sep 15;125(Pt 18):4405-12.
doi: 10.1242/jcs.109603. Epub 2012 Jun 20.
Affiliations
- PMID: 22718347
- PMCID: PMC3516444
- DOI: 10.1242/jcs.109603
Super-resolution imaging of aquaporin-4 orthogonal arrays of particles in cell membranes
Andrea Rossi et al. J Cell Sci. 2012.
Abstract
Aquaporin-4 (AQP4) is a water channel expressed in astrocytes, skeletal muscle and epithelial cells that forms supramolecular aggregates in plasma membranes called orthogonal arrays of particles (OAPs). AQP4 is expressed as a short isoform (M23) that forms large OAPs, and a long isoform (M1) that does not form OAPs by itself but can mingle with M23 to form relatively small OAPs. AQP4 OAPs were imaged with ~20 nm spatial precision by photoactivation localization microscopy (PALM) in cells expressing chimeras of M1- or M23-AQP4 with photoactivatable fluorescent proteins. Native AQP4 was imaged by direct stochastic optical reconstruction microscopy (dSTORM) using a primary anti-AQP4 antibody and fluorescent secondary antibodies. We found that OAP area increased from 1878±747 to 3647±958 nm(2) with decreasing M1:M23 ratio from 1:1 to 1:3, and became elongated. Two-color dSTORM indicated that M1 and M23 co-assemble in OAPs with a M1-enriched periphery surrounding a M23-enriched core. Native AQP4 in astrocytes formed OAPs with an area of 2142±829 nm(2), which increased to 5137±1119 nm(2) with 2-bromopalmitate. PALM of AQP4 OAPs in live cells showed slow diffusion (average ~10(-12) cm(2)/s) and reorganization. OAP area was not altered by anti-AQP4 IgG autoantibodies (NMO-IgG) that cause the neurological disease neuromyelitis optica. Super-resolution imaging allowed elucidation of novel nanoscale structural and dynamic features of OAPs.
Figures
Fig. 1.
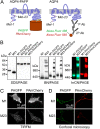
Characterization of cells expressing chimeras of AQP4 and photoactivatable fluorescent proteins. (A) Membrane topography of AQP4 showing C-terminus chimeras with photoactivatable proteins (left) and native AQP4 labeled with an anti-C-terminus AQP4 primary antibody and fluorescent secondary antibodies (right). M1 and M23 translation initiation sites are shown. (B) SDS-PAGE (left) and BN-PAGE (center) immunoblots of total homogenates of U87MG cells expressing native M1- and M23-AQP4 (labeled ‘M1’ and ‘M23’) and M1- and M23-AQP4 containing C-terminus PAGFP or PAmCherry. (Right) hrCN-PAGE showing PAGFP and PAmCherry fluorescence. (C,D) TIRFM (C) and confocal microscopy (D) of indicated AQP4–fluorescent protein chimeras.
Fig. 2.
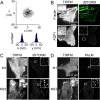
PALM and _d_STORM of cells expressing M1- and M23-AQP4. (A) The localization precision of a single fluorophore was determined by localization of immobilized single AQP1–PAmCherry tetramers. Centers-of-mass and deduced spatial histograms with Gaussian fits are shown. (B) Immunofluorescence (TIRFM) and _d_STORM of F-actin (top) and AQP1 (bottom) in HeLa cells. Insets show magnified views of boxed regions. (C,D) Immunofluorescence (TIRFM) of M1- and M23-AQP4 in U87MG cells and corresponding _d_STORM (C) and PALM (D) reconstructions.
Fig. 3.
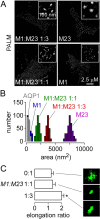
Dependence of OAP size on the ratio of M1- to M23-AQP4. (A) PALM of U87MG cells transfected with M1- and M23-AQP4-PAmCherry at the indicated ratios. Insets show magnified views. (B) Cluster size distributions (numbers of clusters analyzed: M1 = 245, M1:M23 1:1 = 250, M1:M23 1:3 = 220, M23 = 335). (C) OAP elongation ratios (mean ± s.e.m., n = 5 cells; *P<0.05; numbers of clusters analyzed: M23 = 145, M1:M23 1:1 = 115, M1:M23 1:3 = 160).
Fig. 4.
Polarized distribution of M1- and M23-AQP4 in OAPs. (A) PALM of U87MG cells co-expressing M1-AQP4–PAGFP and unlabeled M23-AQP4 in a 1:4 ratio. A diagram of polarized AQP4 distribution is shown on the right. (B) Two-color _d_STORM of U87MG cells co-expressing M1-AQP4–myc and M23-AQP4–HA, labeled with fluorescent anti-myc (red) and anti-HA antibodies (green).
Fig. 5.
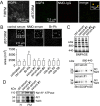
OAP imaging in astrocytes. (A) Primary, well-differentiated cultures of mouse astrocytes were fixed and stained with NMO-IgG (red) and C-terminus anti-AQP4 antibody (green) and imaged using TIRFM and two-color _d_STORM. (B) _d_STORM of astrocytes exposed to control or NMO serum, or treated with 2-bromopalmitate. Average OAP areas summarized at the bottom (mean ± s.e.m., n = 6, P<0.05). (C) BN-PAGE (top) and two-dimensional BN-SDS-PAGE (bottom) of whole-astrocyte homogenates after incubation with control or NMO sera as in B. (D) SDS-PAGE of astrocyte homogenate (H) and plasma membrane fraction (PM) after incubation with control or NMO serum, probed with antibodies against Na+/K+ ATPase (top) and AQP4 (bottom).
Fig. 6.
OAP clustering as a non-specific response to cytotoxicity. (A) TIRFM of primary cultures of mouse astrocytes incubated with rAb-53, with or without C1q, fixed, and stained with AQP4 (red) and C1q (green) antibodies. Right panels show _d_STORM of AQP4, labeled with Alexa-Fluor-488-conjugated C-terminus anti-AQP4 antibody. (B) TIRFM and _d_STORM of mouse astrocytes incubated with rAb-53 and 20% fresh human complement or thapsigargin, stained as in right panels of A. (C) OAP areas (mean ± s.e.m., n = 3, P<0.01).
Fig. 7.
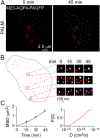
Live-cell PALM of CHO cells expressing M23-AQP4. PALM images (4-min acquisitions) were obtained every 15 min. (A) PALM of M23-AQP4–PAGFP measured at 0 and 45 min. (B) Deduced OAP trajectories over 45 min, with examples of OAP diffusion, fusion and fission shown at the right. Purple arrowhead indicates nascent OAP. (C) Mean squared displacement (MSD); and cumulative probability distribution [P(D)] of diffusion coefficients deduced from single OAP trajectories.
Similar articles
- Neuromyelitis optica IgG does not alter aquaporin-4 water permeability, plasma membrane M1/M23 isoform content, or supramolecular assembly.
Rossi A, Ratelade J, Papadopoulos MC, Bennett JL, Verkman AS. Rossi A, et al. Glia. 2012 Dec;60(12):2027-39. doi: 10.1002/glia.22417. Epub 2012 Sep 14. Glia. 2012. PMID: 22987455 Free PMC article. - Model of aquaporin-4 supramolecular assembly in orthogonal arrays based on heterotetrameric association of M1-M23 isoforms.
Jin BJ, Rossi A, Verkman AS. Jin BJ, et al. Biophys J. 2011 Jun 22;100(12):2936-45. doi: 10.1016/j.bpj.2011.05.012. Biophys J. 2011. PMID: 21689527 Free PMC article. - Aquaporin-4 orthogonal arrays of particles are the target for neuromyelitis optica autoantibodies.
Nicchia GP, Mastrototaro M, Rossi A, Pisani F, Tortorella C, Ruggieri M, Lia A, Trojano M, Frigeri A, Svelto M. Nicchia GP, et al. Glia. 2009 Oct;57(13):1363-73. doi: 10.1002/glia.20855. Glia. 2009. PMID: 19229993 - Live-cell imaging of aquaporin-4 supramolecular assembly and diffusion.
Verkman AS, Rossi A, Crane JM. Verkman AS, et al. Methods Enzymol. 2012;504:341-54. doi: 10.1016/B978-0-12-391857-4.00017-3. Methods Enzymol. 2012. PMID: 22264543 Free PMC article. Review. - Live-cell imaging of aquaporin-4 diffusion and interactions in orthogonal arrays of particles.
Crane JM, Tajima M, Verkman AS. Crane JM, et al. Neuroscience. 2010 Jul 28;168(4):892-902. doi: 10.1016/j.neuroscience.2009.08.034. Epub 2009 Aug 20. Neuroscience. 2010. PMID: 19699275 Free PMC article. Review.
Cited by
- Cytoprotective IgG antibodies in sera from a subset of patients with AQP4-IgG seropositive neuromyelitis optica spectrum disorder.
Tradtrantip L, Yeaman MR, Verkman AS. Tradtrantip L, et al. Sci Rep. 2021 Nov 9;11(1):21962. doi: 10.1038/s41598-021-01294-3. Sci Rep. 2021. PMID: 34753987 Free PMC article. - Influenza A M2 Channel Clustering at High Protein/Lipid Ratios: Viral Budding Implications.
Paulino J, Pang X, Hung I, Zhou HX, Cross TA. Paulino J, et al. Biophys J. 2019 Mar 19;116(6):1075-1084. doi: 10.1016/j.bpj.2019.01.042. Epub 2019 Feb 10. Biophys J. 2019. PMID: 30819568 Free PMC article. - Aquaporin-4 in Astroglial Cells in the CNS and Supporting Cells of Sensory Organs-A Comparative Perspective.
Gleiser C, Wagner A, Fallier-Becker P, Wolburg H, Hirt B, Mack AF. Gleiser C, et al. Int J Mol Sci. 2016 Aug 26;17(9):1411. doi: 10.3390/ijms17091411. Int J Mol Sci. 2016. PMID: 27571065 Free PMC article. Review. - Host-Cell Type Dependent Features of Recombinant Human Aquaporin-4 Orthogonal Arrays of Particles-New Insights for Structural and Functional Studies.
Pisani F, Simone L, Mola MG, De Bellis M, Mastrapasqua M, Ruggieri M, Trojano M, Nicchia GP, Svelto M, Frigeri A. Pisani F, et al. Cells. 2019 Feb 2;8(2):119. doi: 10.3390/cells8020119. Cells. 2019. PMID: 30717425 Free PMC article. - Superresolution imaging of biological systems using photoactivated localization microscopy.
Sengupta P, van Engelenburg SB, Lippincott-Schwartz J. Sengupta P, et al. Chem Rev. 2014 Mar 26;114(6):3189-202. doi: 10.1021/cr400614m. Epub 2014 Jan 13. Chem Rev. 2014. PMID: 24417572 Free PMC article. Review. No abstract available.
References
- Anders J. J., Brightman M. W.1982). Particle assemblies in astrocytic plasma membranes are rearranged by various agents in vitro and cold injury in vivo. J. Neurocytol. 11, 1009–1029 - PubMed
Publication types
MeSH terms
Substances
Grants and funding
- HL73856/HL/NHLBI NIH HHS/United States
- R01 EY013574/EY/NEI NIH HHS/United States
- DK86125/DK/NIDDK NIH HHS/United States
- R01 EB000415/EB/NIBIB NIH HHS/United States
- R01 DK035124/DK/NIDDK NIH HHS/United States
- DK72517/DK/NIDDK NIH HHS/United States
- EY13574/EY/NEI NIH HHS/United States
- DK35124/DK/NIDDK NIH HHS/United States
- R01 HL073856/HL/NHLBI NIH HHS/United States
- P30 DK072517/DK/NIDDK NIH HHS/United States
- RC1 DK086125/DK/NIDDK NIH HHS/United States
- EB00415/EB/NIBIB NIH HHS/United States
- R37 DK035124/DK/NIDDK NIH HHS/United States
- R37 EB000415/EB/NIBIB NIH HHS/United States
LinkOut - more resources
Full Text Sources
Other Literature Sources
Molecular Biology Databases
