Evaluation of 16S rDNA-based community profiling for human microbiome research - PubMed (original) (raw)
Evaluation of 16S rDNA-based community profiling for human microbiome research
Jumpstart Consortium Human Microbiome Project Data Generation Working Group. PLoS One. 2012.
Abstract
The Human Microbiome Project will establish a reference data set for analysis of the microbiome of healthy adults by surveying multiple body sites from 300 people and generating data from over 12,000 samples. To characterize these samples, the participating sequencing centers evaluated and adopted 16S rDNA community profiling protocols for ABI 3730 and 454 FLX Titanium sequencing. In the course of establishing protocols, we examined the performance and error characteristics of each technology, and the relationship of sequence error to the utility of 16S rDNA regions for classification- and OTU-based analysis of community structure. The data production protocols used for this work are those used by the participating centers to produce 16S rDNA sequence for the Human Microbiome Project. Thus, these results can be informative for interpreting the large body of clinical 16S rDNA data produced for this project.
Conflict of interest statement
Competing Interests: The authors have declared that no competing interests exist.
Figures
Figure 1. Overview amplicons and reads generated for both the 3730 and 454 sequencing.
On a schematic representation of the 16S rDNA gene, the known variable regions and the primers used in this study are indicated. Positions and numbering are based on the Escherichia coli reference sequence. The amplicons generated by each primer set are marked in red, and sequencing directions and expected lengths are indicated in orange for 3730 and green for 454.
Figure 2. Minor differences in classifiability as measured by the RDP Classifier and a BLASTn-based approach
. The left panel shows classification based on BLASTn against reference sequences of the MC members. A sequence is classified if it has >95% global sequence identity with one of the reference sequences and >90% of read is contained in the alignable region. Results are shown as a heatmap depicting the frequency values, using a binary logarithm scale. The middle heatmap illustrates frequency values of taxa identified using the RDP classification tool, applying an 80% confidence cutoff. Right panel shows the difference between RDP and BLASTn based classification, with a heatmap representing the ratio of observed genus-level frequency data (RDP) over expected genus-level frequency (BLASTn) for each of the MC members using a binary logarithm scale.
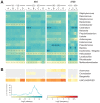
Figure 3. Mock community-based accuracy of community representation compared across technology and 16S window.
The MC was sequenced by different centers on both 3730 and 454 platforms. Each sequencing trial is represented as a column. For 3730 sequencing of the V1–V9 window, amplicons derived from a common amplification protocol were sequenced with short capillaries (1), long capillaries (2), and three reads per clone (3). 454 sequencing was performed by four centers (A, B, C, and D) with three 16S windows (V1–V3, V3–V5, and V6–V9). (A) The observed genus-level frequency data over expected genus-level frequency ratio for each of the MC members is shown as a heatmap using a binary logarithm scale. The expected frequency ratio is based on the whole genome coverages inferred from mapped Illumina WGS reads to the MC reference genome sequences. Genera with observed frequencies differing more than four-fold from expected are marked with + or – for over- or under-representation, respectively. (B) The fraction of misclassified (0.1% of the total combined data set) and unclassified (4.6% of the total combined data set) sequences displayed as a frequency heatmap. The frequency values are depicted as a binary logarithm scale.
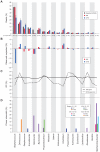
Figure 4. Deviation from expected in the 16S based Mock Community member representation can partially be explained by primer mismatch, not by %GC differences.
The 20 bacterial organisms of the Mock Community are represented by corresponding genus (n = 18) along the bottom of the figure, and across the four panels (DNA from Candida albicans was included in this mock community, but not shown here). (A) The distribution of reads over the 18 genera; The expected frequencies (grey) in the community determined by whole genome shotgun (WGS) sequencing and classified by mapping to reference genomes using BWA, and the observed frequencies determined by 454 reads (red) or 3730 sequences (blue), classified by BLASTn. Error bars indicate standard error from technical replicates. (B) Deviations from expected frequencies as calculated by subtracting expected % from the observed. (C) The average %GC is shown for all its 16S genes, and for their whole genomes. (d) The lowest percent mismatch between primer used in production protocols (Protocols S1 and S2) and any 16S gene copy is shown for each organism; primers are grouped by sequencing technology and 16S window.
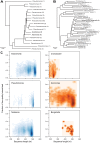
Figure 5. Illustration of how flawed taxonomic schemes and sequence quality can result in incorrect classifications.
The phylogenetic trees were created starting from the full-length reference sequences that were used to train RDP’s taxonomic scheme version 5 for Pseudomonas and Azomonas (A), and Neisseriaceae (B), respectively. These sequences were clustered into 3% OTUs with mothur and representatives for each OTU were selected for building a tree with FastTree. The number of sequences belonging to each OTU is indicated in brackets.(C) Scatter density plots of percent low quality (QV<20) bases per read versus read length is shown for the misclassified reads (red) compared to their correctly classified counterparts (blue).
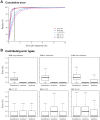
Figure 6. 454 sequences have a higher error rate, mainly resulting from an increased insertion and deletion rate.
(A) For all the quality and chimera filtered 3730 and 454 sequences generated for the MC sample, an alignment-based estimation of errors, including insertions, deletions, and substitutions was performed. For each of the different sequencing approaches, the cumulative frequency distribution of the percent error per sequence is shown for assembled 3730 sequences generated with short capillaries (green), long capillaries (red), and three reads per clone (yellow), and 454 reads spanning the variable regions V1–V3 (light blue), V3–V5 (dark blue), and V6–V9 (fuchsia). A vertical line at 1% was added as a visual aid for upper limit of an acceptable error threshold. (B) Boxplots show the average percentage of errors per read, per sequence approach and per error type, including substitutions, insertions, and deletions. Outliers are not shown.
Figure 7. Error by position profiles indicate hotspots for error.
To visualize where sequencing errors were concentrated along the length of the 16S sequence for each sequencing technology, a root mean square deviation (RMSD) plot was generated for (A) 3730 sequence and (B) 454 read data. The RMSD plot is a graphical representation of the differences in nucleotide distribution between a reference sequence and the samples of interest, for each position along the length of the reference. This figure shows the results for Neisseria meningitidis specifically, but is representative of the profiles observed for the other strains in the MC.
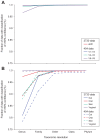
Figure 8. Taxonomic utility of 16S sequence data varies by technology, 16S window, and sample type.
The fraction of successfully classified 3730 and 454 sequences obtained from the MC (A) and clinical samples representing four major body regions (B) is plotted at different taxonomic levels from genus to phylum. Classification was performed on quality and chimera-filtered sequences and considered to be successful if the RDP Classifier result had a confidence score above 80%. In panel B, 454 results include only window V3–V5.
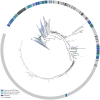
Figure 9. The Lachnospiraceae 16S diversity observed in stool samples is greater than from known reference resources.
A phylogenetic tree constructed with 16S sequences from RDP’s training set (light blue, n = 34), publicly available genomes from human isolates (green, n = 26), publicly available HMP genomes (dark blue, n = 44), and sequences from aggregate stool samples that could be classified at the genus level (dark grey, n = 63) and that remained unclassified at the genus level (light grey, n = 408).
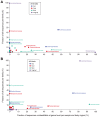
Figure 10. Classifiability of 16S sequence data is differentially impacted by sequencing technology, taxonomic family and body region.
For each of the HMP body regions, the relationship between the average frequency of a given bacterial family (y-axis) versus the contribution of these families to the unclassifiability issue (x-axis) is plotted for (B) 3730 and (C) 454. Only window V3–V5 is presented in 454 results. Classification was performed on quality- and chimera-filtered sequences and classifications assigned only if the RDP Classifier result had a confidence score above 80%.
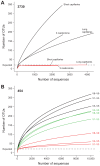
Figure 11. Improved estimation of community diversity after quality filtering and chimera checking, as evaluated by rarefaction analysis.
The number of observed OTUs in the MC is shown as the function of the number of 3730 (A) and 454 (B) sequences, before filtering (black), after quality filtering (green, 454 only), and after combined quality and chimera filtering (red). Rarefaction curves were generated using mothur, with an OTU defined at 97% similarity. (A) For 3730, separate lines show the rarefaction curves for the three different sequencing approaches. (B) For 454, rarefaction curves for the three 16S windows spanning the variable regions V1–V3, V3–V5, and V6–V9 are shown separately, and analysis was performed on a random 10,000-sequence subset from each sample.
Similar articles
- Species-level classification of the vaginal microbiome.
Fettweis JM, Serrano MG, Sheth NU, Mayer CM, Glascock AL, Brooks JP, Jefferson KK; Vaginal Microbiome Consortium (additional members); Buck GA. Fettweis JM, et al. BMC Genomics. 2012;13 Suppl 8(Suppl 8):S17. doi: 10.1186/1471-2164-13-S8-S17. Epub 2012 Dec 17. BMC Genomics. 2012. PMID: 23282177 Free PMC article. - Quantitative Assessment of Shotgun Metagenomics and 16S rDNA Amplicon Sequencing in the Study of Human Gut Microbiome.
Laudadio I, Fulci V, Palone F, Stronati L, Cucchiara S, Carissimi C. Laudadio I, et al. OMICS. 2018 Apr;22(4):248-254. doi: 10.1089/omi.2018.0013. OMICS. 2018. PMID: 29652573 - Profiling of the metabolically active community from a production-scale biogas plant by means of high-throughput metatranscriptome sequencing.
Zakrzewski M, Goesmann A, Jaenicke S, Jünemann S, Eikmeyer F, Szczepanowski R, Al-Soud WA, Sørensen S, Pühler A, Schlüter A. Zakrzewski M, et al. J Biotechnol. 2012 Apr 30;158(4):248-58. doi: 10.1016/j.jbiotec.2012.01.020. Epub 2012 Feb 8. J Biotechnol. 2012. PMID: 22342600 - High throughput sequencing methods for microbiome profiling: application to food animal systems.
Highlander SK. Highlander SK. Anim Health Res Rev. 2012 Jun;13(1):40-53. doi: 10.1017/S1466252312000126. Anim Health Res Rev. 2012. PMID: 22853944 Review. - Then and now: use of 16S rDNA gene sequencing for bacterial identification and discovery of novel bacteria in clinical microbiology laboratories.
Woo PC, Lau SK, Teng JL, Tse H, Yuen KY. Woo PC, et al. Clin Microbiol Infect. 2008 Oct;14(10):908-34. doi: 10.1111/j.1469-0691.2008.02070.x. Clin Microbiol Infect. 2008. PMID: 18828852 Review.
Cited by
- The Human Microbiome Project strategy for comprehensive sampling of the human microbiome and why it matters.
Aagaard K, Petrosino J, Keitel W, Watson M, Katancik J, Garcia N, Patel S, Cutting M, Madden T, Hamilton H, Harris E, Gevers D, Simone G, McInnes P, Versalovic J. Aagaard K, et al. FASEB J. 2013 Mar;27(3):1012-22. doi: 10.1096/fj.12-220806. Epub 2012 Nov 19. FASEB J. 2013. PMID: 23165986 Free PMC article. Clinical Trial. - Synthetic microbe communities provide internal reference standards for metagenome sequencing and analysis.
Hardwick SA, Chen WY, Wong T, Kanakamedala BS, Deveson IW, Ongley SE, Santini NS, Marcellin E, Smith MA, Nielsen LK, Lovelock CE, Neilan BA, Mercer TR. Hardwick SA, et al. Nat Commun. 2018 Aug 6;9(1):3096. doi: 10.1038/s41467-018-05555-0. Nat Commun. 2018. PMID: 30082706 Free PMC article. - Reconstructing the genomic content of microbiome taxa through shotgun metagenomic deconvolution.
Carr R, Shen-Orr SS, Borenstein E. Carr R, et al. PLoS Comput Biol. 2013;9(10):e1003292. doi: 10.1371/journal.pcbi.1003292. Epub 2013 Oct 17. PLoS Comput Biol. 2013. PMID: 24146609 Free PMC article. - A critique of Rossberg et al.: Noise obscures the genetic signal of meiobiotal ecospecies in ecogenomic datasets.
Morgan MJ, Bass D, Bik H, Birky CW, Blaxter M, Crisp MD, Derycke S, Fitch D, Fontaneto D, Hardy CM, King AJ, Kiontke KC, Moens T, Pawlowski JW, Porazinska D, Tang CQ, Thomas WK, Yeates DK, Creer S. Morgan MJ, et al. Proc Biol Sci. 2014 Mar 26;281(1783):20133076. doi: 10.1098/rspb.2013.3076. Print 2014 May 22. Proc Biol Sci. 2014. PMID: 24671969 Free PMC article. No abstract available. - Targeted and highly multiplexed detection of microorganisms by employing an ensemble of molecular probes.
Xu W, Krishnakumar S, Miranda M, Jensen MA, Fukushima M, Palm C, Fung E, Davis RW, St Onge RP, Hyman RW. Xu W, et al. Appl Environ Microbiol. 2014 Jul;80(14):4153-61. doi: 10.1128/AEM.00666-14. Epub 2014 May 2. Appl Environ Microbiol. 2014. PMID: 24795371 Free PMC article.
References
- Zoetendal EG, Vaughan EE, de Vos WM. A microbial world within us. Mol Microbiol. 2006;59:1639–1650. - PubMed
- Frank DN, Pace NR. Gastrointestinal microbiology enters the metagenomics era. Curr Opin Gastroenterol. 2008;24:4–10. - PubMed
Publication types
MeSH terms
Substances
Grants and funding
- U54 HG004973/HG/NHGRI NIH HHS/United States
- U54HG004969/HG/NHGRI NIH HHS/United States
- HHSN272200900018C/AI/NIAID NIH HHS/United States
- HHSN272200900008C/AI/NIAID NIH HHS/United States
- U54 HG004968/HG/NHGRI NIH HHS/United States
- U54HG004973/HG/NHGRI NIH HHS/United States
- U54HG003079/HG/NHGRI NIH HHS/United States
- HHSN2722009000018C/PHS HHS/United States
- U54 HG003079/HG/NHGRI NIH HHS/United States
- U54 HG004969/HG/NHGRI NIH HHS/United States
- U54HG004968/HG/NHGRI NIH HHS/United States
- HHSN272200900001C/AI/NIAID NIH HHS/United States
- U54 AI084844/AI/NIAID NIH HHS/United States
- 1U01HG004866/HG/NHGRI NIH HHS/United States
- U54 HG003273/HG/NHGRI NIH HHS/United States
- U01 HG004866/HG/NHGRI NIH HHS/United States
- U54AI084844/AI/NIAID NIH HHS/United States
LinkOut - more resources
Full Text Sources
Other Literature Sources


